Download
1 / 17
170 likes | 281 Vues
H ealthy People 2010 Focus Area 2 Arthritis, Osteoporosis, and Chronic Back Conditions. P rogress Review July 20, 2006. Arthritis, Osteoporosis, and Chronic Back Conditions. Arthritis and Other Rheumatic Conditions The leading cause of disability

E N D
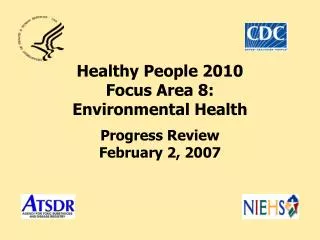
Healthy People 2010Focus Area 2Arthritis, Osteoporosis, and Chronic Back Conditions Progress Review July 20, 2006
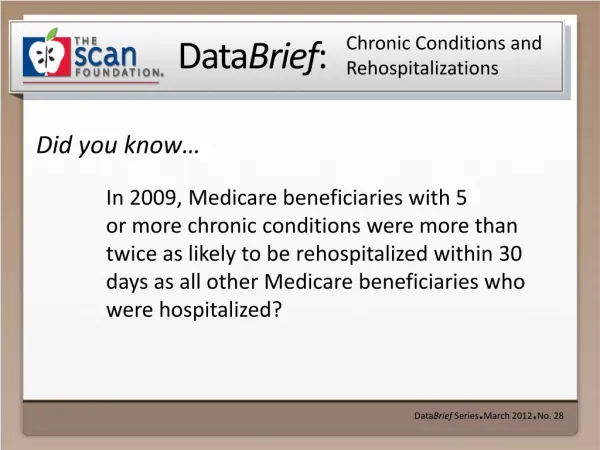
Arthritis, Osteoporosis, and Chronic Back Conditions Arthritis and Other Rheumatic Conditions • The leading cause of disability • Affect 43M or 21% of adults (67M or 25% by 2030), most are under age 65 • Limited activity for 16M or 7.8% of adults (25M or 9.3% by 2030) • Cost $86B (1997) and $127B in 2003 Osteoporosis • Responsible for more than 1.5M fractures, and $14B medical care costs annually Chronic Back Conditions • Affect 26M Americans aged 20-64 • Cost about $100B per year
Focus Area 2Arthritis, Osteoporosis, and Chronic Back Conditions Goal Prevent illness and disability related to arthritis and other rheumatic conditions, osteoporosis, and chronic back conditions Co-Lead Agencies • Centers for Disease Control and Prevention • National Institutes of Health
Arthritis, Osteoporosis, and Chronic Back Conditions Arthritis and Other Rheumatic Conditions 2-1. Mean level of joint pain 2-2. Activity limitations due to arthritis 2-3. Personal care limitations 2-4a. Counseling about overweight and obesity 2-4b. Counseling about physical activity 2-5a. Unemployment rate 2-5b. Effect on paid work 2-6. Racial differences in total knee replacements 2-7. Seeing a health care provider 2-8. Arthritis education in adults Osteoporosis 2-9. Cases of osteoporosis 2-10. Hospitalization for vertebral fractures Chronic Back Conditions 2-11. Activity limitations due to chronic back conditions Note: Objectives in red have had the national baseline established since 2000. Methodology for obj. 2-6 in blue has been defined in 2005.
Diagnosed Arthritis Adults 18 and Older, 2004 Total 18-44 45-64 65-74 75+ BMI -18.4 18.5-24.9 25.0-29.9 30.0-34.9 35.0-39.9 40.0+ Female Male Less than high school High school At least some college 8.8M 20.2M 8.5M 9.0M 0 20 40 60 Age-adjusted percent Note: —95% confidence interval. *Data are statistically unreliable and are suppressed. Data are age adjusted to the 2000 standard population. Education category is for adults 25 and older. Source: National Health Interview Survey, CDC.
Causes of Functional Activities LimitationAdults 18 years and older, 2004 Not Limited 68% Limited 32% Functional Activities Limitation* Note: *Having difficulty in performing specific physical tasks and engaging in social activities and recreation without the assistance of another person or using special equipment. **Based on 16,694 causes reported by 10,760 adults with functional activity limitations. Respondents were asked to report up to 3 causes. All others category includes amputation, endocrine, digestive, genitourinary, skin, blood, cyst, substance abuse, medical treatment, fatigue, and pregnancy. Source: National Health Interview Survey, CDC. Causes of Functional Activities Limitation**
21.2–24.9 Diagnosed Arthritis Adults 18 and Older, 2005 District of Columbia 28.5–32.1 25.0-28.4 Age-adjusted percent Note: Data are age adjusted to the 2000 standard population. Source: Behavioral Risk Factor Surveillance System, CDC.
Mean Level of Joint PainAdults 18 and Older with Arthritis, 2003 Total American Indian Asian Native Hawaiian Black White 2 or more races Hispanic Female Male Less than high school High school At least some college Decrease desired 2010 Target: 5.3 * * * 0 2 4 6 8 10 Level of joint pain on the scale of 1 - 10 Note: —95% confidence interval. *Data are statistically unreliable and are suppressed. Data are age adjusted to the 2000 standard population. American Indian includes Alaska Native; Native Hawaiian includes other Pacific Islander. The categories black and white exclude persons of Hispanic origin. Persons of Hispanic origin may be any race. Respondents were asked to select one or more races. Data for the single race categories are for persons who reported only one racial group. Education category is for adults 25 and older. Source: National Health Interview Survey, CDC. Obj. 2-1
Activity Limitation Due to Arthritis Adults 18 and Older with Arthritis, 2004 Total American Indian Asian Native Hawaiian Black White 2 or more races Hispanic Female Male Less than high school High school At least some college Decrease desired * 2010 Target: 33% 0 20 40 60 80 Age-adjusted percent Note: —95% confidence interval. *Data are statistically unreliable and are suppressed. Data are age adjusted to the 2000 standard population. American Indian includes Alaska Native; Native Hawaiian includes other Pacific Islander. The categories black and white exclude persons of Hispanic origin. Persons of Hispanic origin may be any race. Respondents were asked to select one or more races. Data for the single race categories are for persons who reported only one racial group. Education category is for adults 25 and older. Source: National Health Interview Survey, CDC. Obj. 2-2
Counseling by Medical Care ProviderAdults 18 and Older with Arthritis, 2003 Age-adjusted percent 100 80 60 40 20 0 Weight counseling* Exercise counseling 2010 target Increase desired Total Female Male Less than High At least high school school some college Note: I = 95% confidence interval.*for overweight or obese adults with arthritis. **Exercise counseling for all respondents with or without arthritis, 2001. 2010 target for weight counseling is 46% and exercise counseling is 67%. Data are age adjusted to the 2000 standard population. Education category is for adults 25 and older. Source: National Health Interview Survey, CDC. Obj. 2-4a and 2-4b
Weight Counseling by BMIAdults 18 and Older with Arthritis, 2003 Age-adjusted percent 100 80 60 40 20 0 Increase desired 2010 target: 46% 25.0+ 18.5-24.9 25.0- 30.0- 35.0- 40.0+ 29.9 34.9 39.9 Obj. 2-4a Note: I = 95% confidence interval. Data are age adjusted to the 2000 standard population. Source: National Health Interview Survey, CDC.
Limited Ability to Work due to Arthritis Adults 18-64 with Arthritis, 2003 Total American Indian Asian Native Hawaiian Black White 2 or more races Hispanic Female Male Less than high school High school At least some college Decrease desired * * * 2010 Target: 23% 0 20 40 60 80 Age-adjusted percent Note: — 95% confidence interval. *Data are statistically unreliable and are suppressed. Data are age adjusted to the 2000 standard population. American Indian includes Alaska Native; Native Hawaiian includes other Pacific Islander. The categories black and white exclude persons of Hispanic origin. Persons of Hispanic origin may be any race. Respondents were asked to select one or more races. Data for the single race categories are for persons who reported only one racial group. Education category is for adults 25 and older. Source: National Health Interview Survey, CDC. Obj. 2-5b
Arthritis Education Adults 18 and Older with Arthritis, 2003 Total 6 American Indian Asian Native Hawaiian Black White 2 or more races Hispanic Female Male Less than high school High school At least some college Diabetes education in 1999 * * * Increase desired 2010 Target: 13% * 0 20 40 60 80 Age-adjusted percent Note: —95% confidence interval. *Data are statistically unreliable and are suppressed. Data are age adjusted to the 2000 standard population. American Indian includes Alaska Native; Native Hawaiian includes other Pacific Islander. The categories black and white exclude persons of Hispanic origin. Persons of Hispanic origin may be any race. Respondents were asked to select one or more races. Data for the single race categories are for persons who reported only one racial group. Education category is for adults 25 and older. Source: National Health Interview Survey, CDC. Obj. 2-8
Hospitalizations for Vertebral Fractures Adults 65 and Older, 1998 - 2004 Age-adjusted rate per 10,000 population Decrease desired 25 20 15 10 5 0 2010 target 1998 1999 2000 2001 2002 2003 2004 Obj. 2-10 Note: Data are age adjusted to the 2000 standard population. Source: National Hospital Discharge Survey, CDC.
Activity Limitations Due to Chronic Back Conditions, Adults 18 Years and Older Total Female Male Less than high school High school At least some college Decrease desired 1997 2004 2010 Target: 25 0 20 40 60 80 Age-adjusted per 1,000 Note: —95% confidence interval. Data are age adjusted to the 2000 standard population. Education category is for adults 25 and older.Source: National Health Interview Survey, CDC. Obj. 2-11
Summary Arthritis and Other Rheumatic Conditions • Significant progress in surveillance and monitoring efforts • Baselines established for all objectives to assess progress, including 8 developmental objectives Osteoporosis • Update data for cases of osteoporosis (obj. 2-9) available beginning 2005 NHANES (femur scans) • Increase in hospitalization rates since 2001, perhaps due to use of kyphoplasty Chronic Back Conditions • Reduction in reported activity limitations due to chronic back conditions
Progress review data and slides are available on the web www.cdc.gov/nchs/hphome.htm