Download
1 / 31
310 likes | 454 Vues
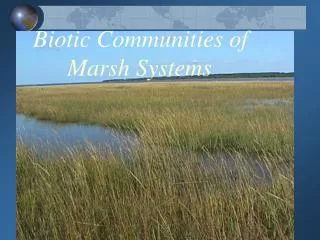
National Marsh Bird Monitoring: Methods, Pilot Study, and Where We Go From Here 16 January 2013. Mark Seamans U.S. Fish and Wildlife Service Lakewood, CO. Webinar Outline. Background History of Marsh Bird Monitoring Survey Protocol and Sampling Design Pilot Study Methods Results

E N D
National Marsh Bird Monitoring:Methods, Pilot Study, and Where We Go From Here16 January 2013 Mark Seamans U.S. Fish and Wildlife Service Lakewood, CO
Webinar Outline • Background • History of Marsh Bird Monitoring • Survey Protocol and Sampling Design • Pilot Study • Methods • Results • Transition from Pilot to Operational Program
Target Species • Rallidae: clapper rail, black rail, king rail, sora, Virginia rail, and yellow rail, common moorhen, purple gallinule, American Coot, purple swamphen • Ardeidae: American bittern, least bittern • Aramidae: limpkin • Podicipedidae: pied-billed grebe • Scolopacidae: Wilson’s snipe
Background • Workshops • 1998, 2006, 2011 • King Rail Conservation Plan 2006 • WaterbirdConservation for the Americas (Waterbirds Initiative) 2006 Assessment • AFWA-Webless Funding Priorities Report 2008 • Independent research
Background Continued • Survey Protocol • Courtney Conway • http://www.cals.arizona.edu/research/azfwru/NationalMarshBird/ • Details of Protocol • Study Design • Johnson, D. H., J. P. Gibbs, M. Herzog, S. Lor, N. D. Niemuth, C. A. Ribic, M. Seamans, T. L. Shaffer, W. G. Shriver, S. V. Stehman, and W. L. Thompson. 2009. A sampling design framework for monitoring secretive marshbirds. Waterbirds 32:230-215.
Pilot Study • Wisconsin 2008 • Idaho 2009 – 2010 • Kentucky 2009 • New York 2009 • Florida 2010 • Michigan 2010 • Ohio 2011
Objectives of Pilot • Do protocol and design work together • Sampling effort to achieve certain levels of precision for abundance or trend estimates. This included thoughts on how to stratify • As pilot progressed shifted focus to work under a new paradigm • How to use monitoring to address management issues • Can monitoring meet information needs for species of greatest concern
Methods • The Data • repeat visits within & among years, strata • Individuals identified (counted) each survey • Distance to individual estimated • Two-stage sample (variance estimator) • Covariates related to detection and abundance • Analysis • Binomial Mixture Model with Horvitz-Thompson Estimator • Detection related to distance done first • Zero-inflated Poisson model with Bayesian Framework • Abundance (& Occupancy) estimated by strata & year
Pilot Results: Occupancy Florida Clapper Rail 2010: φ = 0.81 (0.70-0.92) 95% CI 2011: φ = 0.90 (0.80-0.97) Idaho Sora High Quality Stratum 2009: φ = 0.76 (0.63-0.83) 2010:φ = 0.86 (0.76-0.95) General Stratum 2009: φ = 0.38 (0.18-0.76) 2010: φ = 0.21 (0.10-0.39) Wisconsin Sora 2009: φ = 0.59 (0.50-0.70) 2010: φ = 0.49 (0.38-0.64) 2011: φ = 0.35 (0.25-0.54)
Detection Probability of American Bittern in Idaho (A) and the Upper Midwest (B)
Inferences from Pilot • There are a lot of some species on the landscape • Rare species are an issue • Omnibus approach to monitoring and what we did during the Pilot
Inferences Cont. • What can omnibus approach give us? • Inform harvest management, except for KIRA • Inform state conservation plans? Depends. • May reveal general habitat affinities • What omnibus approach cannot give us. • An assessment of KIRA or BLRA populations • Why they are declining and what to do about it • How any species responds to habitat management • Water levels, burning, invasive management, etc.
Proposed Way Forward • Mix of omnibus and “management monitoring” • Mix of two would give us: • Experimental comparisons • Efficient way to meet needs of multi-species survey
Data can be used to: • Nwrp = abundance from treatment areas • Ngen = abundance from general whole area • H0: Dwrp=Dgen • Ntotal = Nwrp+Ngen(a status assessment)
Marsh Bird Conservation Program Steps to Conserving & Managing Marsh Birds • Define Conservation Issues • Develop Hypotheses or Management Objectives • Develop & Implement Management Actions • Monitor • Learn and repeat as necessary