Download
1 / 9
90 likes | 93 Vues
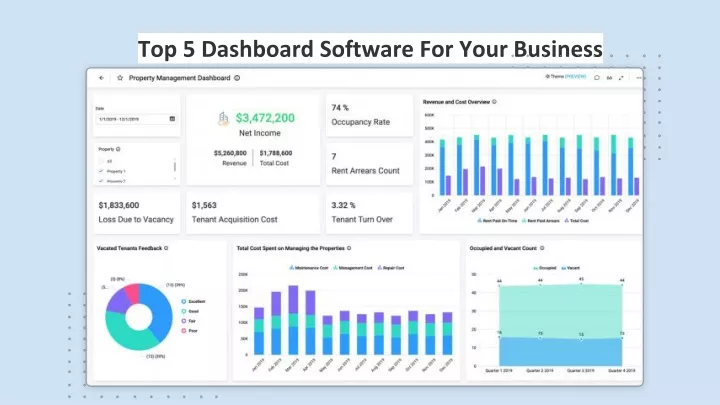
Dashboard software help track KPI metrics and visualize data. Here are the top dashboard software tools.<br>Visit-https://ubiq.co/analytics-blog/top-5-dashboard-software-for-your-business/

E N D
DESCRIPTION Dashboard Software make it easy to track KPI metrics in one place and get at-a-glance status for your business. They also allow you to get insights from data and make better decisions. In this article, we will look at the top 5 dashboard software for your business.
1. Ubiq Ubiq is a powerful dashboard software that allows you to easily connect to your data with a couple of clicks, build charts & dashboards using a drag & drop interface, and share them with your team. It offers more than 35 types of charts & visualizations, including maps. You can easily export charts & dashboards as PDF, Image and CSV files. It even supports automated email reports. Ubiq features a visual dashboard designer that allows you to edit dashboard layout without any coding. It also offers dynamic filters, custom variables, drill-downs, custom css and auto-refresh features. Ubiq also has a robust user management system that allows you to manage user access & permissions. Ubiq offers a 14-day free trial, with paid plans starting from $29/month.
2. Tableau Tableau is one of the most popular data visualization software that allows you to create and share dashboards. It is available as desktop, on-premise and cloud deployments. Tableau is built around the concept of Workbooks and Worksheets, like Microsoft Excel. Users can create and save visualizations onto a Worksheet/Workbook and share it with others. While it is a good data visualization tool, it lacks some of the dashboard reporting features such as ad hoc reporting, dashboard designer, email reports and report sharing. Nevertheless, is is a robust and mature product.
3. Power BI Power BI is also a well-known data visualization software that supports dashboard reporting. It also allows you to visualize data using drag & drop interface and share insights with others. It is easier to use than Tableau and supports ad hoc reporting, email sharing, and report sharing. It also provides deep integration with other Microsoft products such as Microsoft Office. However, its licensing can lead to unexpected costs as your team grows. For example, you need to buy a Power BI Pro license of $9.99/user/month to be able to view and share dashboards. This can lead to increased expenses as you add more people to your team. Power BI is also available as on-premise and cloud deployments.
4. TIBCO Spotfire TIBCO Spotfire is a reputed business intelligence software that allows you to explore, visualize and analyze data. It supports many data sources and is available as on-premise or cloud deployments. It is suitable for sophisticated business intelligence and data analysis for almost every industry. As a result, it has a steep learning curve and requires fair amount of technical expertise to get started. You might even need to undergo training and consultation to become proficient. Nevertheless, it has plenty of features such as recommendation engine, location analytics, predictive analytics, and streaming analytics. TIBCO Spotfire is meant for enterprises and large businesses.
5. Looker Looker is also a feature-rich data visualization software that supports wide range of data sources, and allows them to visualize in various ways. It also features a proprietary data modeling language called LookML to help you define and analyze your data. Since it offers so many features, it is not a self-service software and requires you to schedule a demo, followed by consultation where they help you install and configure Looker for your team. This can take a few weeks time. Also, its pricing is available by quote only. Looker is suitable for large businesses and ente
Conclusion There are many dashboard software available in the market, and many of them offer a free trial. Ensure that you evaluate each dashboard software based on your requirements and budget. If you are looking for a powerful dashboard software that enables you to easily connect to your data, build interactive dashboards quickly, and share them with others, you can try Ubiq.
THANK YOU To Know More please visit: https://ubiq.co/analytics-blog/top-5-dashboard-software-for-your-business/