Download
1 / 3
30 likes | 43 Vues
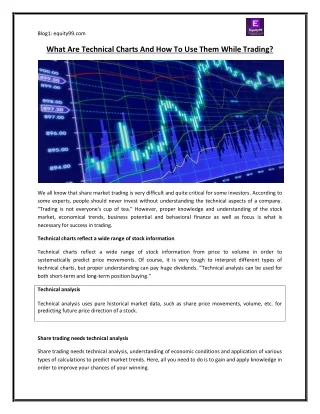
In this article, we will talk about the functionality of Ichimoku Charts and how to use them in forex trading. Here we also learn how to read Ichimoku Charts. The chart seems visually complex, but signals should be accessible. Here you can learn Ichimoku charts, signs and the style of presenting records.

E N D
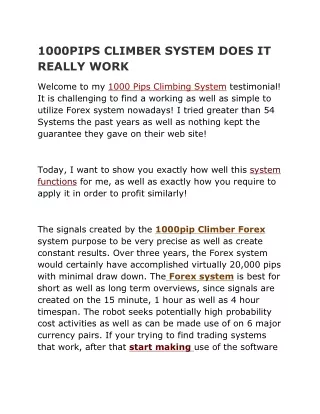
How toUseIchimoku Charts inForexTrading In this article, we will talk about the functionality of Ichimoku Charts and how to use them in forex trading. Here we also learn how to read Ichimoku Charts. Thechart seems visually complex, but signals should be accessible. Here you can learn Ichimoku charts, signs and the styleofpresentingrecords. WhatareIchimokuChartsIndicatorsoratradingsystem? Ichimoku Indicators or trading systems are not newly introduced to the market.It originated in Japan in the sixteenth century. This system combines multiple indicators to develop an overall scenario of the market. It may also provide high probability trading signals to the traders. The Ichimoku tool is mainly used in the futures and commodities markets. But forex recentlystartedusingitintheirmedium. Thetraders that manage a position fora long timeare the primaryusers because this system works well over longer timeframes. Looking at wise charts is a little bit complex but should beeasilyunderstood. The Ichimoku charts Trading System is introduced as an oscillator due to the various trends below and overpricing candlesticks for a particular time interval. The system also consists of the remarkable quality of enhancing as per the future. It may also be depicting prior market sentiments.ItsnomenclaturefollowsJapanesetradition.
But the Cloud consists of different features and three other line indicators that help signal effectivetrading setup and patterns. Traders can eliminate market noise through longer timeframesandraisetheresultsoftheIchimokuIndicatorstechnicalsupporttool. • Traders will get Ichimoku indicators in MetaTrader 4 trading software. Here we provided you withdetailsaboutthemaincomponentsofIchimokuindicators. • Kumo Cloud (the gridded area): These sectors represent resistance and support, distracted from preceding costs data.Thevertex of an “Up”Cloud is Senkou Spans A and B.Main vigilantism happens when candlesticks exit the “cloud”. Multiple lines come in or pass via the particularregions;duringtheCloud changescolour. • Chinkou-span (wrinkled green signal): This line determines market attitude based on current closing prices but flows backwards mainly 26-time intervals. Its location connected to costing data indicates if buyer and seller influence the action, stretching the Cloud’s section should stand outresistanceifitisgoinginsidethepicture. • Tenkan-sen (red line) and Kijun-sen (blue line): These rays are similar to flowing averages and willbe determined from past lows and high nearly 9 and 26 periods, approximately. The Tenkan-sen or The “Green”line is the fastest of the two, and its criss-cross is the primary tradingalert,intervalsitsslopeshifttodeterminethemarket’smomentum. • Senoku span A (green interrupted edges of the Cloud): This creates one of the edges of the Koumo Cloud. It is the quickest moving line signal. See here crossing above the others Trend the Cloud on its crush point. It is determined in the form of some duels, and after that, it plotted26periodsinadvance. • Senkou span B (red cut in edges of the Cloud): It is the lowest edge of the Cloud, and it is determinedbytheaverageofthelow/highofthepast562candlesticks.Itisalsodesigned 26 periods in advance, which is the reason behind cloud stretch more than the final cost candlestick. • The Kumo cloud is utilised in multiple ways to create and develop trading strategies to gain remarkable profits. The section shows resistance and support when the breadth and width state to strength and volatility. When prices are higher from the Cloud, that is known as a “bullish“situationandundera“bearish’situation. • ImminentchangesindirectionshouldbeshownbytheflipsandTwistsoftheCloud. Investors should be counselledtostop when thecandlesticksarepresentintheclouds SenkoboundariesandSpans. • This system will offer ”one look”, as its name suggested for the investors to explain. Depend only on one indicator to createa “macro”view,better than preferringfour inbuiltindicators toseetheinterfunctionofstrictmarketvariables.TheIchimokuChartsindicatorisutilised to determinetimeframemomentumcomparedto the projectedarea of resistance and support. • HowtoreadanIchimokuCharts? • The Ichimoku trading system has the “cloud” and three more line indicators. Stable investors are theprimaryusersofthesechartsbecausewidertimeframesworkefficientlywith Ichimokutradingtools.Itwillprovidedailyandweeklyrecordsthatmayalsoearnsupport.
The “cloud” shows a section of resistance and support. And the linework is similar to the” MACD”signals. Themain factors of referenceare during the multiplecomponents exchange.Thereis a quality of the information provided, but a sophisticated trader waits till costing candlesticks without crack from the “cloud” and other signals. The “Green” signal consists of a “g” setting that permits it to show recent closing prices step backwards 26 intervals, thereby comparing thecompleteshiftalongwiththecontemporarymovementinprice. The“Cloud”performs similarly with the filter, and while price cracks via these areas, along with the series, move below and above, in this case, the breakout situation exists. Again, an intelligent trader should mainly look for further confirmation to bias the negatives into his sides. As we are telling in our all article, technical indicators, either Ichimoku charts or other, will never show 100% correctresult.Wrong signals can occur,but a number of positive signals are somehow enough to provide forex trading with an edge. The ability to explain and to understandIchimokusignsshouldbegeneratedataparticulartime.Itmayalsoget complementing this tool with another indicator that is necessary for more potential and confirmshiftchange.