Download
1 / 2
20 likes | 42 Vues
Share market trading is very difficult and quite critical for some investors. People should never invest & trade without understanding the technical aspects of a company. Read the blog to know about technical charts & its use while trading!

E N D
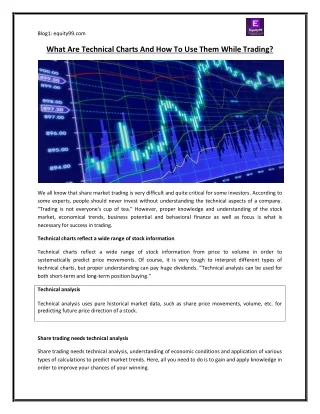
Blog1: equity99.com What Are Technical Charts And How To Use Them While Trading? We all know that share market trading is very difficult and quite critical for some investors. According to some experts, people should never invest without understanding the technical aspects of a company. “Trading is not everyone's cup of tea.” However, proper knowledge and understanding of the stock market, economical trends, business potential and behavioral finance as well as focus is what is necessary for success in trading. Technical charts reflect a wide range of stock information Technical charts reflect a wide range of stock information from price to volume in order to systematically predict price movements. Of course, it is very tough to interpret different types of technical charts, but proper understanding can pay huge dividends. “Technical analysis can be used for both short-term and long-term position buying.” Technical analysis Technical analysis uses pure historical market data, such as share price movements, volume, etc. for predicting future price direction of a stock. Share trading needs technical analysis Share trading needs technical analysis, understanding of economic conditions and application of various types of calculations to predict market trends. Here, all you need to do is to gain and apply knowledge in order to improve your chances of your winning.
Blog1: equity99.com There are three main types of technical analysis charts: Candlestick Bar charts Line charts All these charts are designed to provide the trader with more information. One can use these technical charts as per their trading strategy…. Analyze a stock, enter or exit stocks and manage risks In simple terms, technical analysis is very essential for traders as it guides them through the entire process and enables them to make wide decisions. It also aims to educate and inform traders so that they can understand critical aspects and invest. Besides that, it enables people to analyze a stock, enter or exit stocks and manage risks at the same time. While trading, you should focus on certain elements, such as the high, low, open and closing of stocks. Uptrends and downtrends, supports and resistances According to some experts and analysts, to become a successful trader, one must focus on interpreting technical charts, uptrends and downtrends, supports and resistances and devise their own trading strategies. Make use of both fundamental and technical analysis As a trader, you should daily read technical charts to empower your trading. You should understand technical charts and develop a particular trading approach (top-down approach and the bottom-up). You can choose an approach as per your trading objectives. Understand & follow trend lines, volume indicators, chart patterns and technical indicators Some short-term traders prefer to take a top-down approach while long-term traders pick bottom-up approach. In addition, it is also good to understand and follow trend lines, volume indicators, chart patterns and technical indicators to reap good benefits. As an investor, you can make use of both fundamental and technical analysis to improve overall ROI. And if you want to avoid expensive mistakes, you need to pay attention to patterns, pricing and volume. Are you ready to connect the dots…However, if you are unable to interpret technical charts, then you should talk to a trustworthy investment advisory company that can help you understand critical aspects of a stock and assist you in investing as per your objectives.