How to Unlock Your Data's Location with Power BI Maps
0 likes | 16 Vues
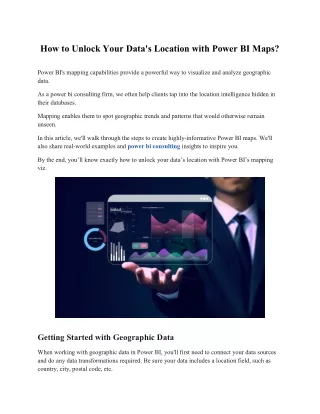
Power BI's mapping capabilities provide a powerful way to visualize and analyze geographic data.<br><br>As a powerBI consulting firm, we often help clients tap into the location intelligence hidden in their databases.<br><br>Mapping enables them to spot geographic trends and patterns that would otherwise remain unseen.<br><br>In this article, we'll walk through the steps to create highly informative Power BI maps. We'll also share real-world examples and power-BI consulting insights to inspire you.<br><br>By the end, youu2019ll know exactly how to unlock your datau2019s location with Power BIu2019s mapping feature.

How to Unlock Your Data's Location with Power BI Maps
E N D
Presentation Transcript
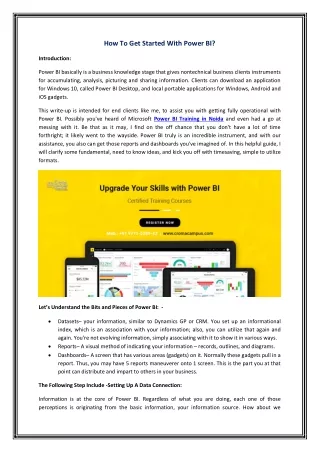
How to Unlock Your Data's Location with Power BI Maps? Power BI's mapping capabilities provide a powerful way to visualize and analyze geographic data. As a power bi consulting firm, we often help clients tap into the location intelligence hidden in their databases. Mapping enables them to spot geographic trends and patterns that would otherwise remain unseen. In this article, we'll walk through the steps to create highly-informative Power BI maps. We'll also share real-world examples and power bi consulting insights to inspire you. By the end, you’ll know exactly how to unlock your data’s location with Power BI’s mapping viz. Getting Started with Geographic Data When working with geographic data in Power BI, you'll first need to connect your data sources and do any data transformations required. Be sure your data includes a location field, such as country, city, postal code, etc.
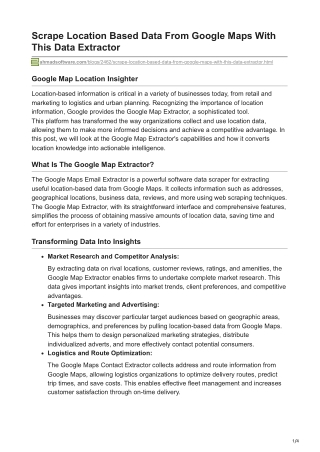
Tip: Geo-enrich your data with a service like Azure Maps or Bing Maps for additional location elements like coordinates and regions. Choosing a Map Visualization Once your geographic data is prepped, you can visualize it on a map. Power BI offers a variety of map viz types to suit different data and analysis needs: ●Filled Maps: Use colored regions on a map to show values associated with countries, states, counties, postal codes, etc. Example: Sales by State. ●Shape Maps: Plot geographic points and customize symbols based on data fields. Example: Store locations with size/color based on revenue. ●Tile Layers: Layer photographic map tiles as a basemap. Example: Plot weather station data over a street map. ●ArcGIS Maps: Connect to Esri ArcGIS maps for demographics, land cover patterns and more contextual map data. The key is matching the right map type with your analysis goal. As your power bi consulting partner, we'll ensure you select the optimal map viz for the insights you want to achieve. Uncovering Geographic Insights Now let's look at two examples of geographic questions Power BI maps can answer: "Which countries have the highest customer satisfaction?" Use a filled map colored by satisfaction score country-by-country. "What's the relationship between income levels and electric vehicle adoption rates by state?" Layer a tile layer map of US household income data over a shape map showing EV purchase percentages by state. Look for spatial correlations. As you can see, map visualizations reveal valuable location-based insights. By mapping your data geographically in Power BI, you can spot regional clusters, trends and outliers. Power BI consulting experts like us will help you formulate geographic questions to uncover actionable intel.
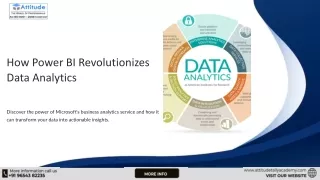
Elevate Your Analysis Now that you know the basics, here are two pro tips to take your Power BI maps to the next level: ●Style maps thoughtfully with data-driven colors, symbols and interactivity to highlight key messages. Well-designed maps effectively direct focus. ●Combine map layers to add contextual meaning. For example, plot franchise locations over heat maps showing demographic stats. With the ability to map all sorts of data from sales and logistics to demographics and opinions, there’s no limit to the location intelligence Power BI can deliver. Let the mapping experts on our power bi consulting team advice you on crafting visually-stunning, insightful maps that speak volumes.