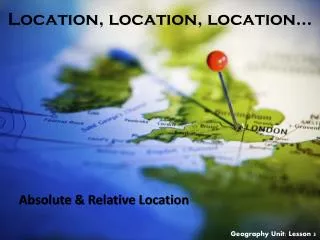
Location, Location, Location Understanding Maps
Location, Location, Location Understanding Maps. Canadian War Museum. Gr. 9 Geography (Applied) CGC1P: Unit 1. How to Label a Map. Cartography is the art of drawing accurate, easily readable, attractive maps. How to Label a Map. Labelling Should be as NEAT as possible

Location, Location, Location Understanding Maps
E N D
Presentation Transcript
Location, Location, LocationUnderstandingMaps Canadian War Museum Gr. 9 Geography (Applied) CGC1P: Unit 1
How to Label a Map Cartography is the art of drawing accurate, easily readable, attractive maps.
How to Label a Map Labelling Should be as NEAT as possible Should be printed in pencil first, then neatly copied in ink (erase pencil lines) Should be spelled accurately Printed parallel to the base of the map River names should curve to follow the course of the river A DOT (.) should be used when labeling cities, placing the name of the city as close as possible The size of labels depends on the amount of information need on the map Larger features usually have larger labels Labels for similar features (capital cities) should be the same size Labels should not block other information on the map DO NOT underline labels
How to Label a Map Colouring/Shading • Maps should be properly colour coded using different colours to show the different areas on the map • Shade consistently avoiding light and dark patches • Use solid colours only • White or black are not to be used as colours on map • Grey should only be used for areas not important to the map • Blue is only to be used for water: lakes, rivers, oceans, sea, bays • When shading large water bodies, ‘feathering’ around the edge is acceptable • Ensure the colours used on the map match the colours used in the legend
Direction on a Map Compass: A method of finding direction Compass Rose In the shape of a circle (360°) Used to indicate direction on a map The 4 CARDINAL POINTS are: North, East, South, West
Direction on a Map The 12 ORDINAL POINTS are: NE, SE, SW, SE, NNE, ENE, ESE, SSE, SSW, WSW, WNW, NNW
Work for Today Complete Introductory Mapping Exercise – due tomorrow in class Work on Directions on a Map Handout (will take up tomorrow)
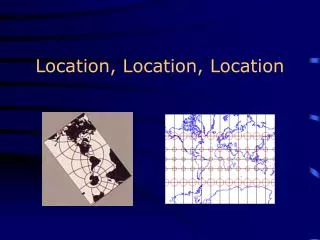
Latitude and Longitude If the Earth were flat, rectangular coordinates (x,y) would be sufficient to describe the locations of points on its surface. However, the Earth is a sphere with no sides, and so a special frame of reference is needed. The Northern and Southern poles provide this reference frame.
Latitude and Longitude Lines of Latitude EQUATOR – an imaginary line that divides the Earth into 2 equal parts (Northern & Southern hemispheres) Are imaginary lines The Equator is the starting point for latitude lines Measure the distance North & South of the Equator Lines are drawn around the Earth, parallel to Equator Lines never intersect each other Lines are approximately 111 km apart Lines are used as political boundaries
Latitude A = B = C = D =
90oN = North Pole 66.5oN = Arctic Circle 23.5oN = Tropic of Cancer 0oN = Equator 23.5oS = Tropic of Capricorn 66.5oS = Antartic Circle 0oS = South Pole
Longitude PRIME MERIDIAN – an imaginary line that divides the Earth into 2 equal parts (Eastern & Western hemispheres) Are imaginary lines The Prime Meridian is the starting point for longitude lines The International Date Line is the 180 meridian Measure the distance East and West of the Prime Meridian Lines are drawn from the North Pole to the South Pole Lines converge at the poles and are furthest apart at the Equator Longitude lines are longer than latitude lines Lines are used to determine time zones: Note of interest: Canada spans almost 90 degrees of longitude and now uses 6 time zones covering 4.5 hrs.
Latitude and Longitude The absolute location of a place can be determined based on latitude and longitude coordinates. Latitude coordinates are written first, followed by longitude coordinates. X place = _____o (N or S), _____o (E or W)
Ottawa = Vancouver = Halifax = Yellowknife =
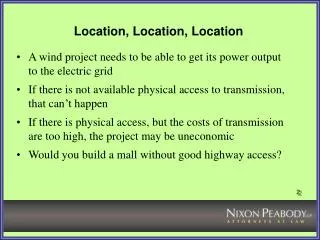
Map Scale • Map scale shows the relationship between the distance on a map and the actual distance on the Earth’s surface • Large scale VS small scale maps • Scale determines the amount of detail a map will show. • Large Scale Maps: show a large amount of detail and a small area. • e.g. 1:50 000, 1:25 000 • Small Scale Maps: show a small amount of detail over a large area. • e.g. 1:250 000, 1:500 000 • *Cool fact*: a map of the world that fits on an 8.5 x 11 inch piece of paper has a scale of 1: 100 million.
Map Scale • Mapping our Location: • Almonte & District High School
Map Scale • Mapping our Location: • Almonte & District High School
Map Scale • Mapping our Location: • Almonte & District High School
Map Scale • Mapping our Location: • Ontario
Map Scale • Mapping our Location: • Canada
Map Scale • Mapping our Location: • World
Map Scale • Direct Statement (DS): a statement about a distance on the map in comparison to the represented distance in the real world. • e.g. “one centimetre represents four kilometres” or • “three centimetres represents eight kilometres”
Map Scale Linear Scale (LS): a straight line divided into units which can be used for measuring distance on a map.
Map Scale • Representative Fraction (RF): a fraction that involves no mention of units. Since units are ignored, whatever you assign to one side must be assigned to the other. • e.g. 1: 50 000 could become, • 1 cm : 50 000 cm or, • 1 m : 50 000 m or, • 1 “size 11 boot” : 50 000 “size eleven boots”
Map Scale Gorham, Maine
Map Scale Scale Overview:
Map Scale • A final reminder about conversions: • 1km (kilometre) = ____________ m • 1m (metre) = ______________cm • 1km = ______________ = 100,000cm
Map Scale Give it a try... KMs between ADHS & Smiths Falls = KMs between ADHS and Cumberland =
Applying Your Learning Learn, Shop, or Play – Mapping Assignment
Different Types of Maps How are different types of maps distinguished?
Different Types of Maps • Political Maps • Usually colored by country or by state/province • List main cities • Highlight boundaries between countries/provinces • Also name certain physical features, such as rivers and lakes
Different Types of Maps • Physical Maps • Have coloursto show natural patterns • Colourson the map can stand for types of vegetation, mountains, and other natural features
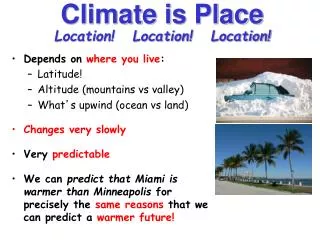
Different Types of Maps • Climate Maps • The climate of a place is the weather it has season after season, year after year • Climate maps show the climate in a certain place
Different Types of Maps • Land Use Resource Maps • These maps show how land is being used. They might highlight: • vegetation • crops being grown • forest vs. agriculture • mines and wells • city zoning
Different Types of Maps • Elevation Maps • Maps that show elevation change by using color or shading.
Different Types of Maps What is the elevation of the San Joaquin Valley?
Different Types of Maps • Topographic Maps • These maps show a small area with a lot of detail. They show elevation with contour lines, natural and man-made features.
Contour Lines Contour lines represent the elevation at that line. If you were to walk across a line, you are changing elevation. What is the difference between the two diagrams at the right?
Contour Lines • A few more notes about contour lines: • Contour lines join the places that have equal elevation. • Used for heights of mountains and depths of oceans. • If someone wants to put a radio tower on the highest peak of Almonte, he/she will look on a map and find the highest contour lines. • Contour lines never touch or cross each other. • The contour interval on one map never changes throughout the entire map.
Were You Listening? This map represents a small area with lots of detail. It has contour lines as well as natural and man-made features. _______________ This map uses colors to show height above sea level. ____________________________ These colorful maps show lines that people use to divide countries and states. They also show major cities. _____________________ These maps show physical features on the Earth like rivers, mountains, and deserts. ____________________________ These maps show how land is being used. For example, they might show which crops are being grown or what animals are being raised. __________________________ These maps show climate regions. ___________________
Pear Mapping Exercise Final Assignment – see handout