Download
1 / 8
80 likes | 228 Vues
The report considers, Nectars as a diluted fruit/vegetable juice and pulp, to which sweetening agents (eg sugar, honey, syrups and/or sweeteners) need to be added for the purposes of production, permitted minerals and vitamins for the purpose of fortification and permitted additives may be added. This report includes top level Nectars consumption actual data for 2010-2014, provisional data for 2015; while forecasts are provided for 2016-2021 across 14 individual countries. The countries covered in the report are China, Hong Kong, India, Indonesia, Japan, Kazakhstan, Malaysia, Pakistan, Philippines, Singapore, South Korea, Taiwan, Thailand, and Vietnam

E N D
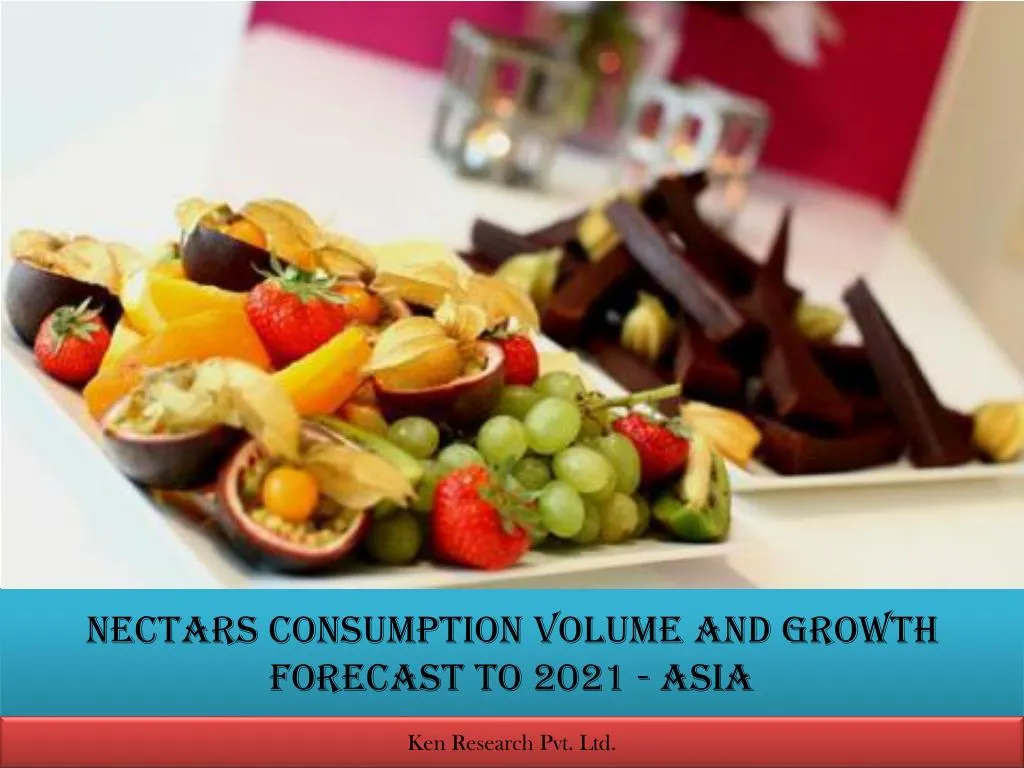
Nectars Consumption Volume and Growth Forecast to 2021 - Asia Ken Research Pvt. Ltd.
Historic and Forecast of Nectar’s consumption The fruit juice industry has forecasted to expand at an annualized rate of 3% from 2016-2021, reaching $317.1 billion. During 2016-2021, Industry Value Added (IVA) which is a measure of an industry's contribution to the overall global economy is expected to grow at an annualized rate of 2.7% whereas global GDP is expected to expand at an annualized rate of 2.7%. As per statistics, Fruit and Vegetables Processing industry grew at an annualized rate of 2.0% till 2016. In 2016, industry revenue is 1.5% to $274.0 billion. Ken Research Pvt. Ltd.
Key Microeconomic Drivers Ken Research Pvt. Ltd.
SWOT Analysis Ken Research Pvt. Ltd.
Countries contributing to Nectars production in Asia Ken Research Pvt. Ltd.
Global Performance of Asia Due to increasing automated business and greater participation in world commerce, demand for processed fruits and vegetables has grown rapidly . The significant effect on food consumption patterns is due to strong industrial growth in China and South East Asia. Over the past few years, industry profit margins have supplemented as global operations have become more technologically advanced. Trade in processed fruit and vegetable products are expected to grow at an annualized rate of 3.3% from 2016-2021 to $70.1 billion. Ken Research Pvt. Ltd.
Scope of the Report • Overview of the Nectar market in Asia. • This report is a comprehensive report which includes top level Nectars consumption actual data for 2010 – 2014, provisional data for 2015 while forecasts are provided for 2016 – 2021. • This report contains quantitative data which provides historic and forecast Nectars consumption data by country in Volume (M Liters). • In depth assessment of profile of providers in order to gain insight of the key offerings in the nectar market space Ken Research Pvt. Ltd.
To know more on the coverage, click on the link below: https://www.kenresearch.com/food-beverage-and-tobacco/non-alcoholic-beverages/nectars-consumption/32054-11.html Related Reports: NECTARS CONSUMPTION VOLUME AND GROWTH FORECAST TO 2021-MENA NECTARS CONSUMPTION VOLUME AND GROWTH FORECAST TO 2021-EAST EUROPE Ankur Gupta, Head Marketing & Communications, Ken Research Email id: query@kenresearch.com Phone No: +91-124-4230204 Contact Information Ken Research Pvt. Ltd.