Download
1 / 11
120 likes | 203 Vues
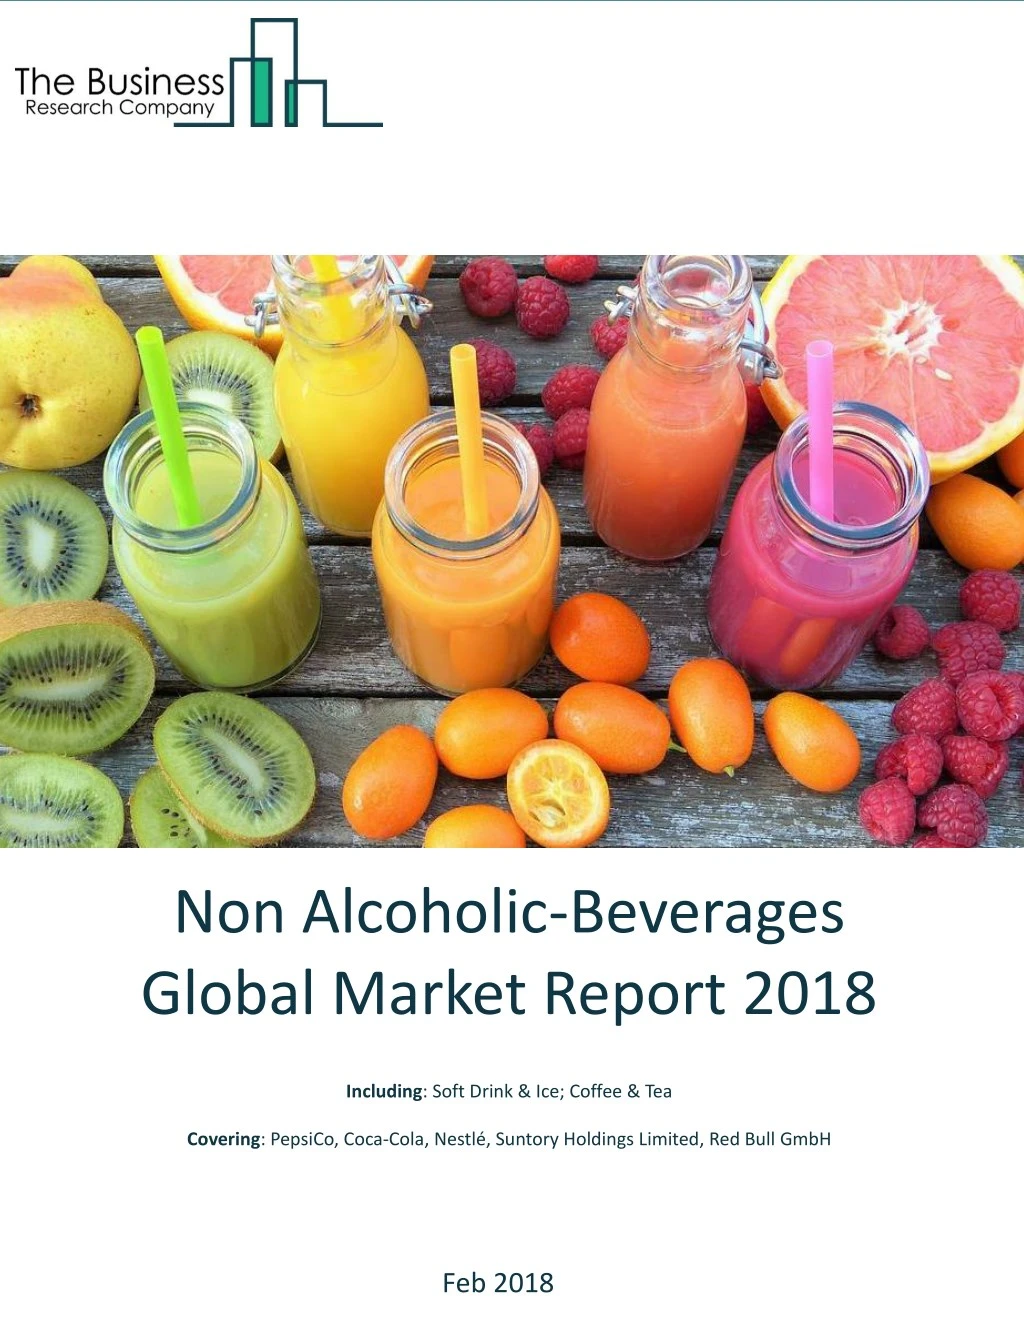
The global non-alcoholic beverages market was valued at around $472 billion in 2017. Read more: https://www.thebusinessresearchcompany.com/report/non-alcoholic-beverages-global-market-report-2018

E N D
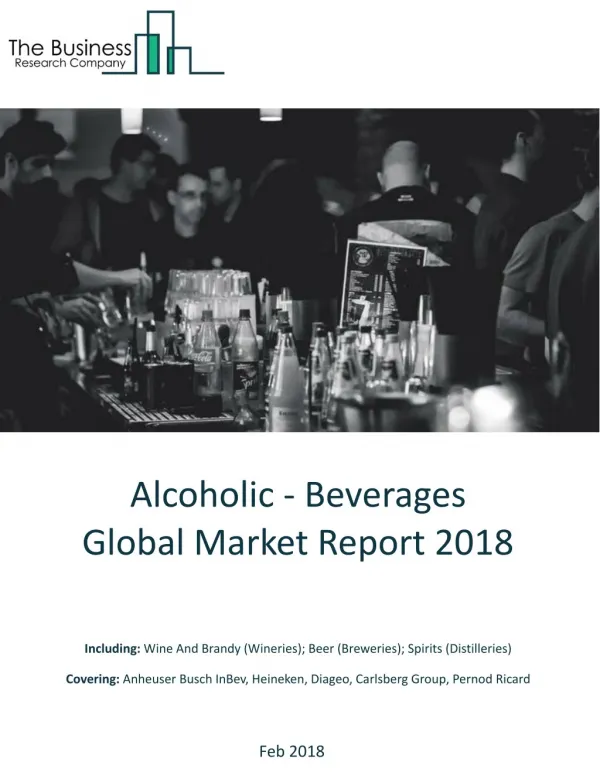
Non Alcoholic-Beverages Global Market Report 2018 Including: Soft Drink & Ice; Coffee & Tea Covering: PepsiCo, Coca-Cola, Nestlé, Suntory Holdings Limited, Red Bull GmbH Feb 2018
Reasons to Purchase • Outperform competitors using accurate up to date demand-side dynamics information. • Identify growth segments for investment. • Facilitate decision making on the basis of historic and forecast data and the drivers and restraints on the market. • Create regional and country strategies on the basis of local data and analysis. • Stay abreast of the latest customer and market research findings • Benchmark performance against key competitors. • Develop strategies based on likely future developments. • Utilize the relationships between key data sets for superior strategizing. • Suitable for supporting your internal and external presentations with reliable high quality data and analysis • Gain a global perspective on the development of the market. • Report will be updated with the latest data and delivered to you within 3-5 working days of order. Scope Markets Covered: Soft Drink & Ice; Coffee & Tea Companies Mentioned: PepsiCo, Coca-Cola, Nestlé, Suntory Holdings Limited, Red Bull GmbH Countries: Brazil, China, France, Germany, India, Italy, Japan, Spain, Russia, UK, USA and Australia. Regions: Asia-Pacific, Western Europe, Eastern Europe, North America, South America, Middle East And Africa Time series: Five years historic and forecast. Data: Ratios of market size and growth to related markets, GDP, Expenditure Per Capita, Non Alcoholic-Beverages Market Indicators Comparison. Data segmentations: Country and regional historic and forecast data, market share of competitors, market segments. Sourcing and Referencing: Data and analysis throughout the report is sourced using end notes.
Non Non- -Alcoholic Alcoholic Beverages Characteristics Characteristics The non-alcoholic beverages market comprises establishments manufacturing beverages that do not contain any alcohol. Non-alcoholic beverages provide hydration, nutrients, vitamins, sugar or calories based on the ingredients used in the manufacturing process. Non-alcoholic beverages market in this report is segmented into coffee and tea, soft drink and Coffee and Tea companies manufacture roasting coffee, blending tea, manufacturing coffee and Soft Drink and Ice companies manufacture soft drinks, ice, and purified and bottled water. This industry is classified into following sub segments Soft Drink establishments manufacture soft drinks and artificially carbonated water. These include fruit and vegetable drinks, iced tea and Bottled Water companies manufacture purified and bottled water. This includes spring water and Ice manufacturing companies manufacture ice in the form of blocks or In this report market value is defined as the revenues organizations earn by selling their goods and services within the specified market, based on the price at which they sell. Only goods and services traded between entities are included. The revenues for a specified geography are consumption values – that is, they are revenues generated by organizations in the specified geography within the specified market, irrespective of where they are produced. Beverages Market Market
Non Non- -Alcoholic Alcoholic Beverages Historic Growth Historic Growth Beverages Market Market The global non-alcoholic beverages market grew from $X billion in 2013 to $X billion in 2017 at a compound annual growth rate (CAGR) of X%. The chart and table below shows the year-on-year growth of the global non- alcoholic beverages market during 2013 – 2017. Drivers of the Market: Restraints on the Market:
Non Non- -Alcoholic Beverages Alcoholic Beverages Market Forecast Growth Forecast Growth Market The global non-alcoholic beverages market is expected to grow from $X billion in 2017 to $574 billion in 2021 at a compound annual growth rate (CAGR) of X%. The chart and table below shows the year-on-year growth of the global non- alcoholic beverages market during 2017 - 2021. Drivers of the Market: Restraints on the Market:
Non Non- -Alcoholic Beverages Alcoholic Beverages Market Segmentation Segmentation Market The chart and table below shows the split of the non-alcoholic beverages market in 2017. The total market value for non-alcoholic beverages was $X billion in 2017. The markets that are covered include Soft Drink & Ice and Coffee & Tea. Soft Drink & Ice market was the x largest segment in the non-alcoholic beverages market with X% share of the market. The market value for the soft drink & ice market was $x billion in 2017. Coffee & Tea made up around X% share of the market. The market value for the coffee & tea was $x billion in 2017.
Non Non- -Alcoholic Beverages Alcoholic Beverages Market Regional And Country Analysis Regional And Country Analysis Market The Asia Pacific was the x largest region in the non-alcoholic beverages market in 2017, non-alcoholic beverages for $X billion or X% market share. North America was the x largest region in the non-alcoholic beverages accounting for $X billion or X% market share. Europe was the x largest region in the non-alcoholic beverages accounting for $X billion or X% market share.
Non Non- -Alcoholic Beverages Alcoholic Beverages Market Competitive Landscape Competitive Landscape Market The leading competitors in the global non-alcoholic beverages market are PepsiCo, Coca-Cola, Nestlé, Suntory Holdings Limited, Red Bull GmbH. The chart and table below displays the percentage market share of the top players in the non-alcoholic beverages market industry. PepsiCo generated revenues of $XX billion for the financial year 2016, an XX% increase from the previous year. Coca-Cola generated revenues of $XX billion for the financial year 2016, an XX% decrease from the previous year. Nestlé generated revenues of $XX billion for the financial year 2016, an XX% increase from the previous year. Suntory Holdings Limited generated revenues of $XX billion for the financial year 2016, an XX% increase from the previous year.
Red Bull GmbH generated revenues of $XX billion for the financial year 2016, an XX% increase from the previous year. Cott Corporation generated revenues of $XX billion for the financial year 2016, an XX% increase from the previous year. Monster Beverage Corporation generated revenues of $XX billion for the financial year 2016, an XX% increase from the previous year. Kraft Heinz Company generated revenues of $XX billion for the financial year 2016, an XX% increase from the previous year. Dr. Pepper Snapple Group Inc. generated revenues of $XX billion for the financial year 2016, an XX% decrease from the previous year. Campbell Soup Company generated revenues of $XX billion for the financial year 2016, an XX% decrease from the previous year. Company Profile PepsiCo Overview PepsiCo, Inc. was the X largest company in the non-alcoholic beverages market in 2017 with a X% share of the market. PepsiCo is a food, snack and beverage manufacturing company, headquartered in New York. The company sells its products under 22 brands globally. Products and Services PepsiCo operates through the following divisions – The Frito-Lay North America (FLNA) division manufactures and sells branded snack foods under the brand names Lays, Doritos, Cheetos,
The Quaker Foods North America (QFNA) division manufactures and sells cereals, rice, pasta, dairy, and other products under the brand names Quaker, Aunt Jemima Cap’n Crunch, and Rice-A-Roni across The PepsiCo Americas Beverages (PAB) division manufactures and sells beverage concentrates, fountain syrups, The PepsiCo Europe (Europe) division manufactures and sells beverages, food and snacks under the brands Lay’s, The PepsiCo Asia, Middle East and Africa (AMEA) division manufactures beverages, food and snacks under the brands Lay’s, Kurkure, Chipsy, Doritos, Strategy PepsiCo's growth strategy focuses on health based non-alcoholic beverages to cater to the increasing demand. For instance, in November 2016, the company acquired KeVita, a North America based Financial Performance PepsiCo’s beverages products generated revenues of $X billion for the financial year 2016, a X% increase from the previous year. It had a market Coca-Cola Overview Products and Services Strategy Financial Performance
Nestlé Overview Products and Services Strategy Financial Performance Suntory Holdings Limited Overview Products and Services Strategy Financial Performance Red Bull GmbH Overview Products and Services Strategy Financial Performance