Download
1 / 56
560 likes | 846 Vues
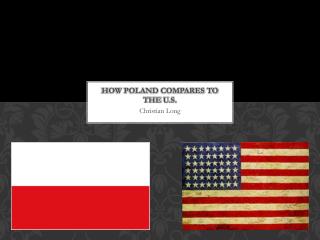
A Marketing Analysis Of The U.S. And Poland Cell Phone Industries. By: Christine Gehringer Andy Mohleuk Melissa Schlosser Maceij Pietrowicz Lina Kasyouhanan Dave Presley. Project Overview. Better understanding of the overall industry and environment in both the U.S. and Poland

E N D
A Marketing Analysis Of The U.S. And Poland Cell Phone Industries By: Christine Gehringer Andy Mohleuk Melissa Schlosser Maceij Pietrowicz Lina Kasyouhanan Dave Presley
Project Overview • Better understanding of the overall industry and environment in both the U.S. and Poland • Market saturation • Growth trends and opportunities • Environmental factors • SWOT analyses • Be able to identify the major players in both the U.S. and Poland
Project Overview • Comparative analysis of U.S. marketing strategies and Poland marketing strategies • Who are the target markets in each country? • How do the two countries market differently? • Understanding the 4 P’s in each country • How do product, price, place and promotion differ between the U.S. and Poland?
U.S. Industry Analysis How it all started… • 1947 – Researchers investigate the use of small cells with frequency reuse to increase the traffic capacity of mobile phones • 1977 – AT&T and Bell Labs constructed a prototype cellular system • 1981 – Motorola and American Radio started a 2nd U.S. cellular radio-telephone system • 1982 – FCC authorized commercial cellular service • 1983 – Ameritech made the first American commercial analog cellular service available
U.S. Industry Analysis MARKET SATURATION • Four major mobile telephony operators: • AT&T Wireless • Sprint PCS • Verizon Wireless • Cingular Wireless In 2001 over $65 billion in revenues was generated with a penetration rate of about 45%
U.S. Industry Analysis GROWTH RATE • 1987 – Cellular telephone subscribers exceed 1 million • 1999 – Spending on wireless communications services totaled $45.2 billion • 2002 – 268 million people in the U.S. live in counties with access to 3 or more different operators • 2003 – Spending projected increase to $75.6 billion
U.S. Industry Analysis INFRASTRUCTURE • 3 major components • Antennas • Base • Towers • Semiconductor integrated-circuits & modems also important • Valued at $100 billion in 2000 • Fixed amount of radio frequency or wireless bandwidth • Vendors work to increase capacity, coverage, and call quality with these set limitations
U.S. Industry Analysis TECHNOLOGY BARRIERS • Digital replacing analog • Benefits • Improve service reliability • Expand capacity of voice systems significantly • Lowers maintenance requirements • Problems • Poor voice quality • Difficult conversion for the cellular operators
U.S. Industry Analysis Threat of New Entrants -Threat of new entrants is high -Moderately unfavorable Bargaining power of buyers Rivalry among existing industry firms Bargaining power of suppliers -Supplier power high -Moderately unfavorable -Buyer power low -Favorable -Rivalry is low to moderate -Moderately favorable Threat of Substitutes -Threat of substitutes is high -Moderately unfavorable
Major Players in U.S. • AT&T • Verizon Wireless • Cingular • Sprint
AT&T • Competitive monthly fee • Best home area coverage • Best national coverage • Unlimited night and weekend minutes • Best rates international calling • Good website – compared to Verizon
Verizon • Largest wireless provider • Lowest monthly fee • Good home area coverage • Good national coverage • Second best international calling • Easy to navigate website/ well organized
Cingular • Second largest wireless supplier • Average home area coverage • No roaming charges from anywhere • Expensive international calling • Poor website/not easy to navigate
Sprint • Smallest of four companies • Average monthly charges • Higher priced phones • Minimal home and national coverage • Minimal/non-existent international calling • Poor website – not easy to navigate and technical problems
Major Players in U.S. • Cellular Service Comparison
Competitive Advantages Summary • AT&T - Best coverage, unlimited nights and weekends • Verizon – Best monthly charges, good coverage, largest supplier • Cingular – No roaming calling from anywhere • Sprint- No competitive advantage noted in comparison
U.S. Environmental Analysis • The Demographic Environment • As of December 2001, 128.5 million subscribers (45% of population) • 268 million people (94% of the total population) have three different operators offering mobile phone service • 229 million people (80 % of the population) live in countries with five or more mobile operators • Nearly 58% of Americans 12 and older own a mobile phone
U.S. Environmental Analysis • The Demographic Environment (cont.) • Geographic: Rural Vs. Urban • Virtually no difference in price • Usage is significantly different
U.S. Environmental Analysis • The Sociocultural Environment • “Cutting the Cord”—growing evidence proves more people are canceling service from their home telephone provider • Almost one in five mobile phone users regard their wireless phone as their primary phone • Even though average pricing has been increasing since 1999, usage has increased to an average of 385 minutes. An increase of 51% from the prior year, during the same month
U.S. Environmental Analysis • The Economic Environment • The average cost per plan is $36.70 • Continued rollout of differentiated plans • The Americas (including Latin America) is the fastest-growing region with a compound annual growth rate of 73%
U.S. Environmental Analysis • The Political/Legal Environment • Deregulation of the Telecom industry • Spectrum licenses: Cellular, Broadband PCS, and SMR
U.S. Environmental Analysis • The Technical Environment • The four main digital technologies used in the U.S.: CDMA, GSM, Iden, and TDMA • Third Generation (3G): cdmq2000 1xRTT, GPRS, and WCDMA • Mobile Satellite Services (MSS) in the U.S.
U.S. Environmental Analysis • The Physical Environment • 276 million people, (97% of the total U.S. Population) live in counties where operators offer digital services using CDMA, TDMA/GSM, or IDEN technologies. These counties make up 70% of the total land are of the U.S.
U.S. SWOT Analysis • Strengths • Lows prices/affordability • Variety of service providers and calling plans • Calling plan benefits • free long distance • wireless web • PDA-like features • Easy of use
U.S. SWOT Analysis • Weaknesses • Customer service • Service provider web sites • not user friendly • Mass marketing strategy • Need to market to different segments • Need to differentiate from competitors • Service contracts
U.S. SWOT Analysis • Opportunities • Wireless web • Bundling • Bundle phone with accessories • Business to Business market • Work on current weaknesses • improve customer service • practice differentiated marketing • improve service provider web sites
U.S. SWOT Analysis • Threats • Satellite communication • Current infrastructure would be rendered obsolete • Two-way radios • Nextel • Government regulations
High Impact Low Impact High Probability • Satellite communication Low Probability U.S. Threat Matrix -Government regulation -Two-way radios
4 P’s in the U.S. • Product • Price • Place • Promotion
4Ps: Product • Voice & data products and services • Text Messaging • Wireless Internet • Family/share plans • Mobile-to-mobile
4Ps: Price • Competitive pricing • Dependant upon local or national plans & number of minutes • “Options” pricing sets companies apart
4Ps: Place • Internet sales & service • Full service stores for sales & service • Retail chains for activation
4Ps: Promotion • TV, Print, Radio, Direct Mailings, and in-store placement • Sponsorships of Movies, TV, and events • Free services
Environmental Analysis • Population 38 million • Europa’s 7th largest market (by population) • Geographics • Economic situation • Political situation
Industry Analysis • Market potential
Major Players in Poland • Centertel • Polska Telefonia Cyfrowa • Polkomtel
Polska Telefonia Cyfrowa SA • Financial Structure • 4.0 million customers • 98% signal coverage • Roaming data unavailable
Polkomtel SA • Financial Structure • 3.6 million customers • 96% signal coverage • Roaming with 227 operators in 113 countries
Centertel SA • Financial Structure • 2.8 million customers • 95% signal coverage • Roaming with 220 operators
Polska Telefonia Cyfrowa SA • Products prepaid individual business
Polkomtel SA • Products Business Individual and prepaid
Centertel SA • Products business individual prepaid
Poland SWOT Analysis • Strengths • High barriers of entry • Financial backing of international companies • Newest technology comparable with biggest foreign competitors
Poland SWOT Analysis • Weaknesses • Small market capitalization • Small customer base • Undifferentiated marketing
Poland SWOT Analysis • Opportunities • Low market saturation • E-banking and other PDA like applications • Direct marketing via cell phone