Download
1 / 70
710 likes | 900 Vues
Diabetes and the Eastern Band of Cherokee. Anthony Fleg Deanndria Seavers Che Smith Brad Wright. Outline. American Indians (AI) and Their Health The Eastern Band of Cherokee and Their Health AI Disparities: A Historical Perspective Video Diabetes Overview: National, State, Cherokee

E N D
Diabetes and the Eastern Band of Cherokee Anthony Fleg Deanndria Seavers Che Smith Brad Wright
Outline • American Indians (AI) and Their Health • The Eastern Band of Cherokee and Their Health • AI Disparities: A Historical Perspective • Video • Diabetes Overview: National, State, Cherokee • Group Discussion Activity • Cultural Competency with American Indians • Small Group Activity • Current Diabetes Programs in Cherokee, N.C. • Q & A
American Indians in the United States • 2.5 - 4.1 million persons • 569 Federally recognized tribes + 300 State recognized tribes • 10% speak lndigenous language in the home • Major U.S. historical markers • 1492 – First encounters with Europeans • 1830 – Indian Removal Act • 1924 – Indian Citizenship Act • 1930s-1960s – Boarding schools
American Indians in North Carolina • There are more American Indians in North Carolina (~ 100,000) than in any other state east of the Mississippi River • Nearly 60% of the AI population in NC belong to the Lumbee Tribe • There are 8 Tribes represented in NC • 7 are state recognized • 1 is federally recognized*
State vs. Federal Recognition • Federally recognized tribes have access to the Indian Health Service (IHS) – blessing or curse? Traditionally, IHS was run 100% out of tribes’ control IHS spends about 50% of what it would take to offer what the average health plan offers Other major issue is that HIS spends 1% of its budget on urban AI, despite the reality that 2/3 of AI live off reservations • State tribes have no guaranteed access to health care services AI in NC have similar access to care barriers as other poor, minority, and rural populations • What are other consequences (positive and negative) to being a state recognized tribe?
American Indian Health in NC • Lots of needs - lack of tribal health system - “invisibility” of AI population - data gap - few health interventions - little political presence - lack of culturally competent care - problems of the rural poor
Lots of resources as well! - tight-knit social/family networks
Lots of resources as well! - tight-knit social/family networks - respect for the “traditional way”
Lots of resources as well! - tight-knit social/family networks - respect for the “traditional way” Ex: Tobacco and the AI Not on Tobacco program “For us, tobacco is sacred. In the older teachings of what it was all about, it was very important to see that it was sacred. A lot of us have forgotten the sacred purposes of tobacco, for various reasons.” - Dennis Nicholas, Kanehsatake Elder, March 2002
Lots of resources as well! - tight-knit social/family networks - respect for the “traditional way” Ex: Tobacco and the AI Not on Tobacco program “For us, tobacco is sacred. In the older teachings of what it was all about, it was very important to see that it was sacred. A lot of us have forgotten the sacred purposes of tobacco, for various reasons.” - Dennis Nicholas, Kanehsatake Elder, March 2002 - strong, central role of faith/churches
Lots of resources as well! - tight-knit social networks - respect for the “traditional way” Ex: Tobacco and the AI Not on Tobacco program “For us, tobacco is sacred. In the older teachings of what it was all about, it was very important to see that it was sacred. A lot of us have forgotten the sacred purposes of tobacco, for various reasons.” - Dennis Nicholas, Kanehsatake Elder, March 2002 - strong, central role of faith/churches • A plug for community asset mapping – the resources are as important as the needs when designing programs/interventions
American Indian Health in the U.S. 2002 CDC Mortality Data for the United States – Top 10 leading causes of death U.S. population American Indian population 1. Heart disease 1. Heart disease 2. Cancer 2. Cancer 3. Stroke 3. Unintentional Injuries 4. COPD 4. Diabetes 5. Unintentional injuries 5. Stroke 6. Diabetes 6. Liver Disease 7. Influenza/pneumonia 7. COPD 8. Alzheimer’s 8. Suicide 9. Kidney disease 9. Influenza/pneumonia 10. Sepsis 10. Homicide Of note: (1) Liver disease, suicide, homicide present only in AI list (2) Diabetes and Unintentional injuries higher up in AI list
American Indian Health in the U.S. Centers for Disease Control (CDC) office has identified a “disproportionately high prevalence”of health inequalities in 4 areas • Mental health • Substance abuse • Obesity • SIDS http://www.cdc.gov/omh/Populations/AIAN/AIAN.htm.
American Indian Health in NC • Limited data, non-existent tribe specific data • AI rates of chronic disease, infectious disease, and unintentional injuries are roughly twice as high as for other North Carolinians
American Indian Health in NC • 2002-3 BRFSS data – touted as a “solution” to the data gap • On 17 of 20 age-adjusted health indicators, there was a “significant health disparity between AI and whites” - Diabetes : 14% vs. 7% - HTN: 40% vs. 27% - Unable to see a doctor due to cost: 29% vs. 12% - Disabled: 39% vs. 25% • Most of the differences persisted after controlling for sociodemographic factors • Prevalence rates similar for AI and African American population in NC • Methods: 16,203 respondents, 434 American Indians (2.7%)
Framing the numbers… • One way to frame it (the biomedical “disparities” approach) – Why are AI experiencing health inequalites? • Intervention: Study AI, and then tailor a program to address AI risk factors • Another framework – What social and health inequities, shared by AA, AI and other underserved groups lead to similarly high rates of disease? Intervention: Study all affected groups, and address the larger structures of inequities shared by AA, AI, etc.
American Indian Health in NC Recommendations for improving AI health in NC* • Data, Information and Gaps • Sovereignty, Governance and Systems • Access to Prevention and Care Services *2004-5 DHHS + NC Commission of Indian Affairs Joint Task Force on Indian Health
Eastern Band of Cherokee • Trace their people back 11,000+ years • Once controlled 140,000+ square miles (much of current-day 8 southern states) • Each village governed itself, and had a peace chief, a war chief, and a priest • Matriarchal system • Sequoyah – created an alphabet for Tsalagi (Cherokee language)
There are 7 Cherokee clans -Wolf -Deer -Wild Potato -Long Hair -Blue -Bird -Paint
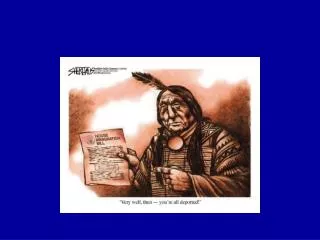
Trail of Tears • Cherokee had served as important allies for the U.S. against the French and British, but their land became increasingly desired (for plantations, possible gold) • In 1838, 17,000 Cherokee were forcibly marched westward by U.S. Army • On the 6 month journey to Oklahoma, 1 in 4 died • Those who hid from the Army, along with those who returned, became the Eastern Band of Cherokee
Eastern Band of Cherokee Today • 13,000 live in/around Qualla boundary (56,000 acres) in Cherokee, NC • Thriving casino and tourism industry • Tribe has taken control of the IHS hospital Cherokee Indian Hospital
Cherokee Health • Poverty rates are falling – 31% down to 22% since Casino opened • Obesity rates twice the state average, close to 50% (2003)* • 60% of 6-11 year old youth were overweight or obese (2003)* • Surprisingly, data is still hard to find! * Source: http://www.cdc.gov/pcd/issues/2006/jul/pdf/05_0221.pdf
Understanding the persistence of American Indian Health Inequalities
Historical influences on Health and Health Care Health • Foreign diseases • Economic and social discrimination • ? Health care • Mistrust of Providers • Mistrust of Health care institutions • ?
Havasupai Tribe vs. Arizona State University • Professors worked with members of the tribe to design a project to study a pressing medical issue of the tribe -- diabetes -- in 1989. • The resulting "Diabetes Project" was supposed to offer three components: Diabetes education, collecting/testing blood samples from members to identify diabetics or people who are susceptible to the disease, and conducting genetic testing "to identify an association between certain gene variants and diabetes.“ • In 2003, a tribal member approached ASU administrators and asked if the blood samples had been used for research other than that agreed to by the tribal members. Source: Arizona Daily Sun
The independent investigation uncovered "... numerous unauthorized studies, experiments and projects by various universities and laboratories throughout the United States ..." that resulted in at least 23 scholarly papers, articles and dissertations that involved the Havasupai blood samples. Fifteen of those publications dealt with subjects that had nothing to do with diabetes -- like schizophrenia, inbreeding and theories about ancient human population migration to North America. -Arizona Daily Sun article
Editorial in Nature: Leaders from both communities need to reach out to each other to bridge the gap between their cultures. The National Human Genome Research Institute is funding work to do precisely this. One group in a unique position to help are Native American scientists: they too can support dialogues to create a research environment to match the genetic opportunities of the times. Source: http://www.nature.com/nature/journal/v430/n6999/full/430489a.html
Health Inequities in the American Indian Population • A 500 year history • First explained by providential explanations:
Providential explanations “If God were not pleased with our inheriting these parts, why did he drive out the natives before us?” -Winthrop (1634)
Providential (cont.) • Foreign disease introduced (intentional and un-intentional) “Where we were most welcome, where we baptized most people, there it was in fact where they died the most” -Lalement (1640)
Behavioral explanations • Behavioral explanations for disease • Explaining smallpox, which reduced tribal nations by 50-95% (e.g. 5-50% were left), destructive Indian behaviors were blamed – indifference to cleanliness, reckless use of sweat baths and the “vicious and dissolute” life caused by alcohol • Disease became a tool of moral exhortation
Behavioral (cont.) According to missionaries, if vice brought disease to American Indians, then acceptance of Christian morality and lifestyles would bring them health -Jones DS, AJPH 2006
In the 19th century, health theories moved to consider the effects of government policies • Reservation system enacted in 1830s-1870s…there was faith that civilization would eventually bring health to the American Indians
Disparities in health and health resources persisted • In 1890, govt. was spending $1.25 per Indian (vs. $20-$40 per military personnel) • 1917 – as spending on AI health began to increase, this was the first year in 50 years where birth rate > death rate • 1925 – TB rates (per 100,000): U.S. (87), AI (603), Arizona AI (1510)
Recent and current frameworks • Environmental factors • Genetic explanation of disease rates • SES as proxy for “social determinants” of health • Recognition that increased tribal control of health services is necessary • Race/discrimination rarely considered
Another perspective: historical trauma as a health risk Featuring Ann Bullock, MD
Diabetes Basics • Chronic disease that affects the body’s ability to properly produce or use insulin • Four major types of diabetes: type 1, type 2, gestational and prediabetes. • Type 2 diabetes (non-insulin dependent diabetes mellitus), is the adult-onset condition accounting for 90-95% of diagnosed cases • Risk factors: family history of diabetes, previous gestational diabetes, impaired glucose metabolism, physical inactivity and race/ethnicity
Diabetes Complications • heart disease • stroke • kidney disease • nerve damage • eye problems • skin conditions • foot complications • depression
Depression & Diabetes • Rates of depression are nearly twice as high among diabetics than non-diabetics • Depression reduces quality of life and is associated with increased morbidity, mortality, and health care costs • Not a statistically significant difference by race/ethnicity (p=0.08) • Source: Bell RA et al. Prevalence and correlates of depressive symptoms among rural older African Americans, Native Americans, and Whites with diabetes. Diabetes Care 28(4): 823-829
Depression & Diabetes (cont.) • Definite physiological and behavioral links • Questions remain as to causal order • Hard to quantify the prevalence in AI compared to other populations • Dx by responses to a set of questions • Historical trauma and stress make differences in baseline likely • “Depression may be the norm” for AI, so it won’t show up as easily (underdiagnosed) • Cultural Biases – The classic AI is NOT stoic – This is the result of a coping mechanism for trauma
Pre-diabetes Pre-diabetes • The NIH, CDC and the American Diabetes Association show that about 40% of Americans between ages 40 and 74 have pre-diabetes • Type 2 can be prevented
Treatment • Improving glycemic and blood pressure control have shown to be effective • Improved glycemic control can be achieved through regular physical activity • Pre-diabetes shown preventable through regular exercise and a proper diet
Obesity • Link between obesity and the increased chance of developing diabetes • 2005 CDC estimates show between 25-29% of population obese • 2002 North Carolina Diabetes Summary showed that 21.8% of NC is obese • Obesity trend may increase rate of pre-diabetics/diabetics
National and State Data In US: • In 2005, the national prevalence of all types of diabetes was at 20.8 million Americans, or 7% of the population, with 6.2 million who have been undiagnosed In NC: • In 2004, an estimated 584,000 people with diabetes. • Between 1995 and 2000, the prevalence of diabetes in adult population increased 42%