Statistical Analysis in Case-Control studies
Statistical Analysis in Case-Control studies. Summer International Workshop Aug, 09, Beijing. Liu Tian Genome Institute of Singapore liut2@gis.a-star.edu.sg. Outline . Introduction Basic Statistical Methods of Case-control Study GWAS A Novel Epistasis-testing Procedure .


Statistical Analysis in Case-Control studies
E N D
Presentation Transcript
Statistical Analysis in Case-Control studies Summer International Workshop Aug, 09, Beijing Liu Tian Genome Institute of Singapore liut2@gis.a-star.edu.sg
Outline Introduction Basic Statistical Methods of Case-control Study GWAS A Novel Epistasis-testing Procedure
Aim of Genetic Studies Dramatic variation do exist within a same spice Almost every biological phenomenon involves a genetic component There is always a keen need for us to seek the genetic variation relates to complex traits.
Different Design Strategies Intervention studies Clinic trials Observational studies Case-control studies Cohort studies
exposed non-exposed population Disease +/- Cohort Studies A cohort study is a study where a group of individuals are followed. Cohort studies can be either prospective or retrospective
Case-Control Studies Case-control studies are used to identify factors that may contribute to a medical condition by comparing subjects who have that condition (the ‘cases’) with patients who do not have the condition but are otherwise similar (the ‘controls’) Case-control studies are retrospective and non-randomized
exposed non-exposed non-exposed exposed population Case-Control Studies Disease - Disease +
Selection of Cases Population-based cases: include all subjects or a random sample of all subjects with the disease at a single point or during a given period of time in the defined population. Hospital-based cases: All patients in a hospital department at a given time
Selection of Controls Principles of Control Selection: Study base: Controls can be used to characterise the distribution of exposure Comparable-accuracy: Equal reliability in the information obtained from cases and controls (to avoid systematic misclassification) Overcome confounding: Elimination of confounding through control selection (matching or stratified sampling)
Selection of Controls General population controls: registries, households, telephone sampling costly and time consuming recall bias eventually high non-response rate Hospitalised controls: Patients at the same hospital as the cases Easy to identify; less recall bias; higher response rate
Case-Control Studies vs. Cohort Studies Cohort study • Rare exposure • Examine multiple effects of a single exposure • Minimizes bias in the in exposure determination • Direct measurements of incidence of the disease Case-control study • Quick, inexpensive • Well-suited to the evaluation of diseases with long latency period • Rare diseases • Examine multiple etiologic factors for a single disease
Case-Control Studies vs. Cohort Studies Case-control study • Not rare exposure • Incidence rates cannot be estimated unless the study is population based • retrospective, non-randomized nature limits the conclusions that can be drawn from them. Cohort study Not rare diseases Prospective: Expensive and time consuming Retrospective: in adequate records Validity can be affected by losses to follow-up
sample id case/control genotypes Data Structure of Case-control studies
Outline Introduction Basic Statistical Methods of Case-control Study GWAS A Novel Epistasis-testing Procedure
Population-Based Case-Control Study Individuals are unrelated To test if marker genotypes distribute differently between the cases and controls By comparing within cases and controls, we identify those genetic factors correlated with a pre-defined phenotype
Coding Genotypes For one marker with two alleles, there can be three possible genotypes:
Genetic Models and Underlining Hypotheses Genotypic Model Hypothesis: all 3 different genotypes have different effects Genotypic value is the expected phenotypic value of a particular genotype AA vs. Aa vs. aa
Genetic Models and Underlining Hypotheses • Dominant Model Hypothesis: the genetic effects of AA and Aa are the same (assuming A is the minor allele) AA and Aa vs. aa
Genetic Models and Underlining Hypotheses • Recessive Model • Hypothesis: the genetic effects of Aa and aa are the same (A is the minor allele) AA vs. Aa and aa
Genetic Models and Underlining Hypotheses Allelic Model Hypothesis: the genetic effects of allele A and allele a are different A vs. a
Pearson’s Chi-squaredTest • Genotypic Model: • Null Hypothesis: Independence df = 2
Pearson’s Chi-squaredTest • Dominant Model: • Null Hypothesis: Independence df = 1
Pearson’s Chi-squaredTest • Recessive Model: • Null Hypothesis: Independence df = 1
Pearson’s Chi-squaredTest • Allelic Model: • Null Hypothesis: Independence df = 1
Test Statistic • Chi-squared Test Statistic: • O is the observed cell counts • E is the expected cell counts, under null hypothesis of independence
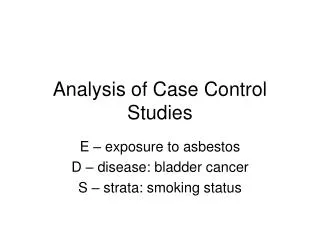
Example • The following table summarize the genotype counts of marker M : • Different tests can be performed: - Allelic test - Dominant gene action - Recessive gene action - Genotypic test
Example (Dominant Gene Action) • Using R: • dominant_table <- matrix(c(80,90,20,10), ncol = 2) • print(dominant_table ) • chisq.test(dominant_table ,correct=FALSE)
Example (Recessive Gene Action) • Using R: • recessive_table <- matrix(c(36,18,164,182), ncol = 2) • print(recessive_table) • chisq.test(recessive_table,correct=FALSE)
Example (Genotypic Test) • Using R: • genotypic_table <- matrix(c(36,18,100,84,64,98), ncol = 3) • print(genotypic_table) • chisq.test(genotypic_table,correct=FALSE)
Example (Allelic Test) • Using R: • allelic_table <- matrix(c(172,120,228,280), ncol = 2) • print(allelic _table) • chisq.test(allelic_table,correct=FALSE)
Logistic Regression Analysis A General Model: Where: pdisease is the probability that an individual has a particular disease. β0 is the intercept β1, β2 …βJ are the effects of genetic factors X1, X2 …XJ are the dummy variables of genetic factors
Logistic Regression Analysis Logistic regression describes the relationship between a dichotomousresponse variable and a set of explanatory variables. Logit model is the only model under which β, the effect parameter, can be estimated in retrospective studies as same as in prospective studies. If the sampling rate for cases is 10 times that for controls, the intercept estimated is log(10) =2.3 than the one estimated with a prospective study.
Inference and Interpretation Significant test focus on: Estimator is the estimated odds ratio for genetic factor i. The sign of determines whether is increasing or decreasing when the effect of genetic factor i exists.
Other Options Fisher’s Exact Test: When sample size is small, the asymptotic approximation of null distribution is no longer valid. By performing Fisher’s exact test, exact significance of the deviation from a null hypothesis can be calculated. For a 2 by 2 table, the exact p-value can be calculated as:
Other Options • Cochram-Armitage Trend Test -- An advantage of the Cochran-Armitage test is that it does not assume Hardy-Weinberg equilibrium -- Typically used to test a 2 × k contingency table, when the effects of AA, Aa, and aa are thought to be ordered. -- In genome-wide association studies, the additive (or codominant) version of the test is often used.
Outline • Introduction • Basic Statistical Methods of Case-control Study • GWAS • A Novel Epistasis-testing Procedure
Genome-wide Association Study • In genetic epidemiology, a genome-wide association study (GWAS) - also known as whole genome association study (WGA study) - is an examination of genetic variation across a given genome, designed to identify genetic associations with observable traits. In human studies, this might include traits such as blood pressure or weight, or why some people get a disease or condition. From: http://en.wikipedia.org
Genome-wide Association Study • Technology makes it feasible -- Affymetrix: 500K; 1M chip arrives in early 2007. (Randomly distributed) -- Illumina: 550K chip costs (gene-based) • Requires little on sample, Case-control data, case-parents trio data are enough. • Good for moderate effect sizes ( odds ratio < 1.5). • Particularly useful in finding genetic variations that contribute to common, complex diseases.
What Is A SNP? TTCAGTCAGATCCTAGCCC Chromosome 1 AAGTCAGTCTAGGATCGGG TTCAGTCAGATCCCAGCCC Chromosome 2 AAGTCAGTCTAGGGTCGGG Single Nucleotide Polymorphism
Handling GWAS • Storing and converting large amounts of genotype data • Quality control • Generating initial association analysis • Specialized analysis
Quality Control Of SNPs • Exclude SNPs that failure the Hardy-Weinberg test -- Expected proportions of genotypes are not consistent with observed allele frequency -- HWE p-value < 10-4 to 10-6 • Genotyping success rate < 95% • Differential missingness in cases and controls
Quality Control Of Samples • Poor quality samples -- Sample genotype success rate < 95 to 97.5% -- Greater proportion of heterozygous genotypes than expected • Related individuals (if independent samples) -- Based on pair-wise comparisons of similarity of genotypes • Samples with miss specified gender
Genetic Stratification • Assess population structure • Adjust both phenotypes and genotypes for possible stratification using --principal component analysis (Price’s method) -- cluster analyses (Plink) • Genomic Control
Software Demonstration • Plink -- Case/control, TDT, quantitative traits
-- Develop by Shaun Purcell http://pngu.mgh.harvard.edu/~purcell/plink/
Software Demonstration • Haploview: -- LD and haplotype block analysis -- tag SNP selection algorithm -- visualization and plotting GWAS results from PLINK http://www.broadinstitute.org/haploview/haploview