Download
1 / 7
70 likes | 125 Vues
Here's how we helped a leading consultancy firm that wanted to identify the purchase behavior of respondents who have purchased apparel, footwear and bags, belts and wallets, books, and electronic goods or services online at least once in the last 6 months.<br><br>

E N D
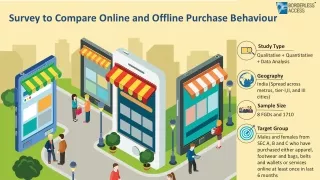
Survey to Compare Online and Offline Purchase Behaviour Study Type Qualitative + Quantitative + Data Analysis Geography India (Spread across metros, tier-I,II, and III cities) Sample Size 8 FGDs and 1710 Target Group Males and females from SEC A, B and C who have purchased either apparel, footwear and bags, belts and wallets or services online at least once in last 6 months 1
What was the research requirement? One of the leading consultancy firms wanted to identify the purchase behaviour of respondents who have purchased apparel, footwear and bags, belts and wallets, books, and electronic goods or services online at least once in the last 6 months 2
What was the research objective? • To understand the differences and decision drivers for online and offline purchase behaviour • To understand brand preferences and associations related to etailers • To capture consumers’ behaviour with respect to offline purchase (frequency, formats, spends, etc. on lifestyle) and how this compare to consumers’ current online behaviour. • Identify improvement areas for etailers 3
What were the challenges? Our biggest challenge was to meet the hard and interlocking quotas among age, gender, city, occupation, marital status and consumer purchase segment We had very rigid timelines. We had to complete the qualitative and quantitative data collection and deliver the data in SPSS with cross- tabulations and factor analysis in 10 days. 4
How did Borderless Access solve the problem? • We conducted 8 FGDs for the client in tier 1 and tier 2 cities, to understand the category purchase behaviour and preferences. • The insights were shared with the client and were incorporated in the quantitative questionnaire. • Our technology team programmed the survey and carried out quality checks to ensure that the quota logics / algorithms were in place and data was being captured properly. • The project management team deployed samples as well as sent reminders at regular intervals. • The cross-tabulations schema were pre-decided with the client and communicated to our tabulation teams, to avoid any delay. • Factor analysis and Normalization was performed to understand decision drivers 5
Outcome • We were able to achieve the required sample size with the quotas within the expected timelines. • The client was able to deliver powerful insights to the end client • Our efforts were reflected in improved client experience and regular project inflow 6
Contact-Us CHICAGO, IL Tel : +1 312 720 0378 USA CALIFORNIA Tel : +1 818 358 4633 www.borderlessaccess.com UK LONDON Tel : +44 771 840 3458 Business Enquiries rfp@borderlessaccess.com marketing@borderlessaccess.com GERMANY MUNICH Tel : +49 (0) 176 650 94033 Connect with us DUBAI Tel : +97 150 137 3145 UAE INDIA BANGALORE Tel : +91 804 931 3800