STOCK INDEX FUTURES A STOCK INDEX IS A SINGLE NUMBER BASED ON INFORMATION ASSOCIATED WITH A BASKET STOCK PRICES AND
STOCK INDEX FUTURES A STOCK INDEX IS A SINGLE NUMBER BASED ON INFORMATION ASSOCIATED WITH A BASKET STOCK PRICES AND QUANTITIES. A STOCK INDEX IS SOME KIND OF AN AVERAGE OF THE PRICES AND THE QUANTITIES OF THE STOCKS THAT ARE INCLUDED IN THE BASKET. THE MOST USED INDEXES ARE

STOCK INDEX FUTURES A STOCK INDEX IS A SINGLE NUMBER BASED ON INFORMATION ASSOCIATED WITH A BASKET STOCK PRICES AND
E N D
Presentation Transcript
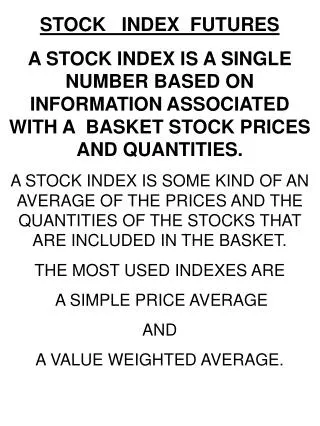
STOCK INDEX FUTURES A STOCK INDEX IS A SINGLE NUMBER BASED ON INFORMATION ASSOCIATED WITH A BASKET STOCK PRICES AND QUANTITIES. A STOCK INDEX IS SOME KIND OF AN AVERAGE OF THE PRICES AND THE QUANTITIES OF THE STOCKS THAT ARE INCLUDED IN THE BASKET. THE MOST USED INDEXES ARE A SIMPLE PRICE AVERAGE AND A VALUE WEIGHTED AVERAGE.
STOCK INDEXES - THE CASH MARKET A. AVERAGE PRICE INDEXES: DJIA, MMI: N = The number of stocks in the index D = Divisor P = Stock market price INITIALLY D = N AND THE INDEX IS SET AT A GIVEN LEVEL. TO ASSURE INDEX CONTINUITY, THE DIVISOR IS CHANGED OVER TIME.
EXAMPLES STOCK SPLITS 1. 2. 1. (30 + 40 + 50 + 60 + 20) /5 = 40 I = 40 and D = 5. 2. (30 + 20 + 50 + 60 + 20)/D = 40 The index remains 40 and the new divisor is D = 4.5
CHANGE OF STOCKS IN THE INDEX 1. 2. 1. (30 + 20 + 40 + 60 + 50)/5 = 40 I = 40 and D = 5. 2. (30 + 120 + 40 + 60 + 50)/D = 40 The index remains 40 and the new divisor is D = 7.5
STOCK #4 DISTRIBUTED 40% STOCK DIVIDEND (30 + 120 + 40 + 60 + 50)/D = 40 D = 7.5. Next, (30 + 120 + 40 + 36 + 50)/D = 40 The index remains 40 and the new divisor is D = 6.9 STOCK # 2 SPLIT 3 TO 1. (30 + 40 + 40 + 36 + 50)/D = 40 The index remains 40 and the new divisor is D = 4.9
ADDITIONAL STOCKS • 1. • 2. • (30 + 50 + 40 + 60 + 20)/5 = 40 • D = 5 I = 40. • 2. • (30 + 50 + 40 + 60 + 20 + 35)/D = 40 • D = 5.875.
VALUE WEIGHTED INDEXES S & P500, NIKKEI 250, VALUE LINE B = SOME BASIS TIME PERIOD INITIALLY t = B THUS, THE INITIAL INDEX VALUE IS SOME ARBITRARILY CHOSEN VALUE: M. For example, the S&P500 index base period was 1941-1943 and its initial value was set at M = 10. The NYSE index base period was Dec. 31, 1965 and its initial value was set at M = 50.
Conclusion: The return on a value weighted index in any period t, is the weighted average of the individual stock returns; the weights are the dollar value of the stock as a proportion of the entire index value.
THE BETA OF A PORTFOLIO THEOREM: A PORTFOLIO’S BETA IS THE WEIGHTED AVERAGE OF THE BETAS OF THE STOCKS THAT COMPRISE THE PORTFOLIO. THE WEIGHTS ARE THE DOLLAR VALUE WEIGHTS OF THE STOCKS IN THE PORTFOLIO. In order to prove this theorem, assume that the index is a well diversified portfolio, I.e., it represents the market portfolio. In the proof, P denotes the portfolio; I, denotes the index and I denotes the individual stock; i = 1, 2, …, N.
STOCK PORTFOLIO BETA STOCK NAMEPRICESHARESVALUE WEIGHTBETA PORTFOLIO BETA: .044(1.00) + .152(.8) + .046(.5) + .061(.7) + .147(1.1) + .178(1.1) + .144(1.4) + .227(1.2) = 1.06
A STOCK PORTFOLIO BETA STOCK NAMEPRICESHARESVALUE WEIGHT BETA PORTFOLIO BETA: .122(.95) + .187(1.1) + .203(.85) + .048(1.15) + .059(1.15) + .076(1.0) + .263(.85) + .042(.75) =.95
Sources of calculated Betas And calculation inputs SourceIndexDataHorizon Value Line Investment Survey NYSECI Weekly Price 5 yrs(Monthly)* Bloomberg S&P500I Weekly Price 2 yrs (Weekly) www.quote.bloomberg.com Bridge Information Systems S&P500I Daily Price 2 yrs (daily) www.bridge.com Nasdaq Stock Exchange www.nasdaq.com Media General Fin. Svcs. (MGFS)S&P500I Monthly Price 3 (5) yrs www.mgfs.com (Monthly) Quicken.Excite.com www.quicken.excite.com MSN Money Central www.moneycentral.msn.com DailyStock.com www.stocksheet.com Standard & Poors Compustat SvcsS&P500I Monthly Price 5 yrs (Monthly) + Dividend S&P Personal Wealth www.personalwealth.com S&P Company Report (via brokerage) Charles Schwab Equity Report Card S&P Stock Report (via brokerage account) Argus Company ReportS&P500I Daily Price 5 yrs (Daily) (via brokerage subscription) *Updating frequency.
Sources of calculated Betas And calculation inputs SourceIndexDataHorizon Market Guide S&P500I Monthly Price 5 yrs (Monthly) www.marketguide.com Yahoo!Finance www.yahoo.marketguide.com Motley Fool www.fool.com WWorldly Investor www.worldlyinvestor.com Individual Investro www.individualinvestor.com Quote.com www.quote.com Equity Digest (via brokerage account) ProVestor Plus Company Report (via brokerage account) First Call (via brokerage account)
Sources of calculated Betas And calculation inputs Example: ß(GE) 6/20/00 Sourceß(GE)IndexDataHorizon Value Line Investment Survey 1.25 NYSECI Weekly Price 5 yrs (Monthly) Bloomberg 1.21 S&P500I Weekly Price 2 yrs (Weekly) Bridge Information Systems1.13 S&P500I Daily Price 2 yrs (daily) Nasdaq Stock Exchange 1.14 Media General Fin. Svcs. (MGFS)S&P500I Monthly P ice 3 (5) yrs Quicken.Excite.com 1.23 MSN Money Central 1.20 DailyStock.com 1.21 Standard & Poors Compustat SvcsS&P500I Monthly Price 5 yrs (Monthly) S&P Personal Wealth 1.2287 S&P Company Report) 1.23 Charles Schwab Equity Report Card 1.20 S&P Stock Report 1.23 AArgus Company Report1.12S&P500I Daily Price 5 yrs (Daily) Market Guide S&P500I Monthly Price 5 yrs (Monthly) YYahoo!Finance 1.23 Motley Fool 1.23 WWorldly Investor 1.231 Individual Investor 1.22 Quote.com 1.23 Equity Digest 1.20 ProVestor Plus Company Report 1.20 First Call 1.20
STOCK INDEX OPTIONS ONE CONTRACT VALUE = (INDEX VALUE)($MULTIPLIER) One contract = (I)($m) ACCOUNTS ARE SETTLED BY CASH SETTLEMENT
STOCK INDEX OPTIONS THE MAIN REASON FOR THE DEVELOPMENT OF INDEX OPTIONS WAS TO ENABLE PORTFOLIO AND FUND MANAGERS TO HEDGE THEIR POSITIONS. ONE OF THE BEST STRATEGIES IN THIS CONTEXT IS THE PROTECTIVE PUTS. THAT IS, IF THE MARKET VIEW IS THAT THE MARKET IS GOING TO FALL IN THE OFFING, PURCHASE PUTS ON THE INDEX. QUESTIONS: 1. WHAT EXERCISE PRICE WILL GUARANTY THE PROTECTION LEVEL REQUIRED BY THE MANAGER.? 2. HOW MANY PUTS TO BUY? THE ANSWERS ARE NOT EASY BECAUSE THE UNDERLYING ASSET - THE INDEX - IS NOT THE SAME AS THE PORTFOLIO WE ARE TRYING TO PROTECT. WE NEED TO USE SOME RELATIONSHIP THAT RELATES THE THE INDEX VALUE TO THE PORTFOLIO VALUE.
The protective put consists of holding the unaltered portfolio and purchasing n puts. The premium, the exercise price and the index are levels and must be multiplied by the $ multiplier, $m.
ONE SUCH RELATIONSHIP COMES FROM THE CAPITAL ASSET PRICING MODEL WHICH STATES THAT FOR ANY SECURITY OR PORTFOLIO, i: the expected excess return on the security and the expected excess return on the market portfolio are linearly related by their beta: THE INDEX TO BE USED IN THE STRATEGY, IS TAKEN TO BE A PROXY FOR THE MARKET PORTFOLIO, M.FIRST, REWRITE THE ABOVE EQUATION FOR THE INDEX I AND ANY PORTFOLIO P :
Second, rewrite the CAPM result, with actual returns: In a more refined way, using V and I for the portfolio and index market values, respectively: Notice that in this expression the returns on the portfolio and on the index are in terms of their initial values, indicated by V0, I0 , plus any cash flow, dividends in this case , minus their terminal values at time 1, indicated by V1 and I1.
NEXT, USE THE RATIOS Dp/V0 AND DI/I0 AS THE PORTFOLIO’S DIVIDEND PAYOUT RATE, qP, AND THE INDEX’ DIVIDEND PAYOUT RATE, qI,DURING THE LIFE OF THE OPTIONS AND REWRITE THE ABOVE EQUATION: Which may be rewritten as: Notice that the ratio V1/ V0indicates the portfolio required protection ratio.
FOR EXAMPLE: • indicates that the manager wants the end-of-period portfolio market value, V1, to be down no more than 90% of the initial portfolio market value, V0. We denote this desired level by (V1/ V0)*. • We are now ready to answer the two questions associated with the protective put strategy: • What is the appropriate exercise price, X? • How many puts to purchase?
1. The exercise price, X, is determined by substituting I1 = X and the portfolio required protection level, (V1/ V0)* into the equation: and solving for X: The solution is: 2. The number of puts is:
We rewrite the Profit/Loss table for the protective put strategy: We are now ready to calculate the floor level of the portfolio: V1+n($m)(X- I1)
We can solve for V1 the equation: From the profit/loss table, The floor level: Floor level = V1+n($m)(X- I1), Which can be rewritten as: Floor level = V1+n($m)X – n($m)I1
Thus, substitution of V1 into the equation for the Floor Level, yields: It is important to observe that the final expression for the Floor Level is in terms of known parameter values. That is, management knows the minimum portfolio value at time 1, at the time the strategy is opened!!!
A SPECIAL CASE: NOTICE THAT IF β = 1 AND IF THE DIVIDEND RATIOS ARE EQUAL, qP =qI, THEN:
EXAMPLE: A portfolio manager expects the market to fall by 25% in the next six months. The current portfolio market value is $25M. The portfolio manager decides to require a 90% hedge of the current portfolio’s market value by purchasing 6-month puts on the S&P500 index. The portfolio’s beta with the S&P500 index is 2.4. The index stands at a level of 1,250 points and its dollar multiplier is $250. The annual risk-free rate is 10%, while the portfolio and the index annual dividend payout rates are 5% and 6%, respectively. The data is summarized below:
The exercise price of the puts is: Solution: Purchase n = 192 six-months puts with X= 1,210. The Floor level is calculated as follows:
Holding the portfolio and purchasing 192 protective puts on the S&P500 index, guarantee that the portfolio value, currently $25M, will not fall below $22,505,000 in six months. Moreover, If the S&P500 index remains above the puts’ exercise price of 1,210, the portfolio market value in six months will exceed the floor level of $22,505,000.
A SPECIAL CASE: Let us assume that in the above example, βp= 1 and qP =qI, THEN: