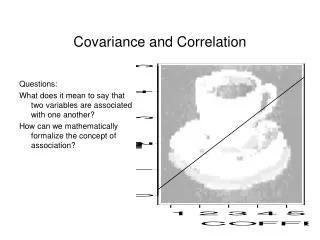
Techniques for studying correlation and covariance structure
Techniques for studying correlation and covariance structure. Principal Components Analysis (PCA) Factor Analysis. Principal Component Analysis. Let . have a p -variate Normal distribution . with mean vector . Definition:. The linear combination.


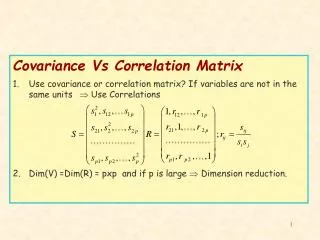
Techniques for studying correlation and covariance structure
E N D
Presentation Transcript
Techniques for studying correlation and covariance structure Principal Components Analysis (PCA) Factor Analysis
Let have a p-variate Normal distribution with mean vector Definition: The linear combination is called the first principal component if is chosen to maximize subject to
Consider maximizing subject to Using the Lagrange multiplier technique Let
Now and
Summary is the first principal component if is the eigenvector (length 1)of S associated with the largest eigenvalue l1 of S.
The complete set of Principal components Let have a p-variate Normal distribution with mean vector Definition: The set of linear combinations are called the principal components of if are chosen such that
and • Var(C1) is maximized. • Var(Ci) is maximized subject to Ci being independent of C1, …, Ci-1 (the previous i -1 principle components) Note: we have already shown that is the eigenvector of S associated with the largest eigenvalue, l1 ,of the covariance matrix and
We will now show that is the eigenvector of S associated with the ithlargest eigenvalue, li of the covariance matrix and Proof (by induction – Assume true for i -1, then prove true for i)
Now has covariance matrix
Hence Ci is independent of C1, …, Ci-1 if We want to maximize subject to Let
Now and
Now hence (1) Also for j < i Hence fj = 0 for j < I and equation (1) becomes
are the eignevectors of S associated with the eigenvalues Thus and • Var(C1) is maximized. • Var(Ci) is maximized subject to Ci being independent of C1, …, Ci-1 (the previous i -1 principal components) where
Recall any positive matrix, S where are eigenvectors of S of length 1 and are eigenvalues of S.
Example In this example wildlife (moose) population density was measured over time (once a year) in three areas.
picture Area 3 Area 2 Area 1
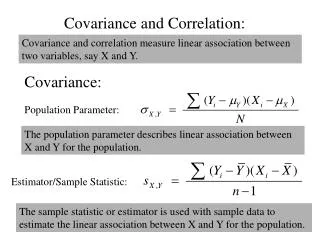
The Sample Statistics The mean vector The covariance matrix The correlation matrix
Principal component Analysis The eigenvalues of S The eigenvectors of S The principal components
Area 3 Area 2 Area 1
Area 3 Area 2 Area 1
Area 3 Area 2 Area 1
Graphical Picture of Principal Components Multivariate Normal data falls in an ellipsoidal pattern. The shape and orientation of the ellipsoid is determined by the covariance matrix S. The eignevectors of S are vectors giving the directions of the axes of the ellopsoid. The eigenvalues give the length of these axes.
Recall that if S is a positive definite matrix where P is an orthogonal matrix (P’P = PP’ = I) with the columns equal to the eigenvectors of S. and D is a diagonal matrix with diagonal elements equal to the eigenvalues of S.
The vector of Principal components has covariance matrix
An orthogonal matrix rotates vectors, thus rotates the vector into the vector of Principal components Also tr(D) =
The ratio denotes the proportion of variance explained by the ithprincipal component Ci.
Also where
Comment: If instead of the covariance matrix, S, The correlation matrix R, is used to extract the Principal components then the Principal components are defined in terms of the standard scores of the observations: The correlation matrix is the covariance matrix of the standard scores of the observations:
Recall: Computation of the eigenvalues and eigenvectors of S
continuing we see that: For large values of n
The algorithm for computing the eigenvector • Compute rescaling so that the elements do not become to large in value. i.e. rescale so that the largest element is 1. • Compute using the fact that: • Compute l1 using
Repeat using the matrix • Continue with i = 2 , … , p – 1 using the matrix Example – Using Excel - Eigen