Download
1 / 23
230 likes | 438 Vues
Waste Water Emissions in Austria. Michael Nagy. Contents of Presentation. Goals of Emission Indicators in Austria „Classical“ Policy Demands Nowadays Policy Demands Examples Outlook Conclusion. Goals of Emission Indicators in Austria. To answer national policy relevant questions:

E N D
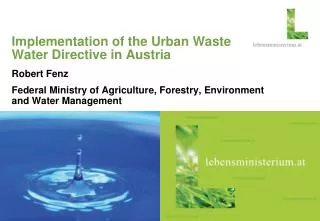
Waste Water Emissions in Austria Michael Nagy
Contents of Presentation • Goals of Emission Indicators in Austria • „Classical“ Policy Demands • Nowadays Policy Demands • Examples • Outlook • Conclusion
Goals of Emission Indicators in Austria • To answer national policy relevant questions: • Status • Trends • Forecasts • Fulfillment of international reporting exercises: • EU-Urban Waste Water Treatment Directive • EU-Water Framework Directive • EPER PRTR • Eurostat / OECD Joint Questionnaire on Inland Waters • ....
“Classical” Policy Demands • “Classical” policy relevant questions: • What is the % of population connected to collecting system and urban waste water treatment plants? • Is pollution from urban areas and industry increasing or decreasing? • “Classical” indicators • Population connected to collecting system and waste water treatment plants • Waste water quantities (m³) discharged (urban / industry) • Organic pollutants (BOD / COD) discharged (urban / industry) • Nutrients (Nitrogen and Phosphorus) discharged (urban / industry) • (Dangerous substances)
Characteristics of „Classical“ Waste Water Indicators • Focus on point sources discharging into surface waters • Policy relevant questions were related to the facts that: • pollution of surface waters stemmed mainly from point sources • big potential for improvement of treatment technologies and production processes • Indicators have been the basis for regulations on limitation of discharged pollutants (production sector specific), investments, subsidies and other measures • Indicators have been used for monitoring of progress and assessment of achievement of policy goals
„Classical„ Indicator: Connection Rate to Sewerage Goal as defined in 90ies: achieved
“Classical” Indicator: Treatment Efficiencies and Discharges
Nowadays Questions (Examples) with Policy Relevancy • Which measures (as e.g. required according to EU-WFD) are the most cost-effective ones? • What are the costs to reduce 1 unit of a pollutant discharged from agriculture / industry / urban areas / ....? • What are the socio-economic effects of measures (to reduce pressures on waters caused by pollution)? • What are the socio-economic effects originating from polluted waters? • Health of society • Economic activities dependent from clean water: e.g. fishery, drinking water production, tourism,... • Other uncertain effects of loss of healthy environment
Characteristics of nowadays Waste Water Indicators • Better consideration of diffuse pollution to consider ALL sources of pollution • Sector-specific aggregation link with economic indicators • Goals • identify cost-efficient measures • assess socio-economic effects • monitor effects of changed production-technologies • ...
Economic indicators Economic activities Emissions NAMEA-Table Austria („Butterfly – matrix“ on direct discharges)) .....
COD Emissions (direct discharges) COD Households Manufacture of pulp, paper and paper products (21) Manufacture of chemicals and chemical products (24) Sewage and refuse disposal, sanitation and similar activities (90)
Nitrogen Emissions (direct discharges) Nitrogen (total) Agriculture, hunting and related service activities (01) Forestry (02) Households
Chrome Emissions (direct discharges) Chrome Manufacture of other non-metallic mineral products (26) Manufacture of basic metals (27) Manufacture of textiles (17) Leather (19)
Data Collection • A lot of „historically grown” data collections exist: • National Accounts • Every-day water management • National reports on the status of the environment • International reporting obligations (WFD, UWWTD, EPER,...) • Austrian Emissions Inventory: updated once a year with data from regional authorities (for each individual “significiant” discharger) • To further develop emission accounts • Demonstrate usefulness to policy makers (e.g. for purposes of EU-WFD) • Use already existing data collections as far as possible (usually legally binding) • Modify data collections (and their legal basis) where this is necessary (coverage, sector-specific aggregation)
Outlook • Emission accounts project in 2006: • Use of data of the Austrian Emission Inventory on Surface Waters (developed according to EU-WFD, covers “significant” point sources and diffuse sources) for NAMEA-Water Emissions (2004-2005 data) • Develop methodology for consistent time-series based on WFD-data • Overall goal: Regular update on the basis of WFD-data
Conclusion • Emission accounts are addressing nowadays policy-relevant questions • Existing data collection system is not very flexible – use of existing data sets as far as possible • Set-up specific data collections where necessary (e.g. Emissions Register) • Promotion of usefulness of (emission) accounts is very important: • discussion of costs and benefits of measures • discussion with different stakeholders (e.g. agriculture versus industry as polluters of waters) • monitoring of environmental efficiency • definition of policy goals
Data for Moneris • data of river flow (from gauging stations) • water quality (nutrient concentrations from monitoring stations) • statistical data about nutrient inputs into the catchment • geographical data (stored and analysed in a Geographic Information System (GIS) • If contacts to developers of Moneris and further background material are needed send me an email: nagym@un.org
Other relevant information on diffuse emissions • European Harmonised Procedures for Quantification of Nutrient Losses from Diffuse Sources - EUROHARP • Web: http://euroharp.org/index.htm