A Baseball Statistics Class
A Baseball Statistics Class Jim Albert Department of Mathematics and Statistics Bowling Green State University albert@bgnet.bgsu.edu Supported by the National Science Foundation Outline Describe the intro stats class at BGSU Why focus a class on sports? Examples of Data analysis


A Baseball Statistics Class
E N D
Presentation Transcript
A Baseball Statistics Class Jim Albert Department of Mathematics and Statistics Bowling Green State University albert@bgnet.bgsu.edu Supported by the National Science Foundation
Outline • Describe the intro stats class at BGSU • Why focus a class on sports? • Examples of Data analysis • Examples of Probability • Examples of Inference • Address some questions
MATH 115 – Introduction to Statistics • Satisfies math elective for students in College of Arts and Sciences • Required by students in health college • Students have range of math skills • Goal of course is statistical literacy – how does one draw conclusions from data • Book is at the level of Moore, Basic Practice of Statistics
Class is hard to teach • No one wants to take stats. • Easy to focus on number crunching rather than concepts. • Students have little interest in the topics and datasets discussed. • How to make the class more relevant to everyday life?
Statistics can made more interesting if we capitalize on “good” datasets • Come in raw form • Are authentic • Are intrinsically interesting • Are topical or controversial • Offer substantial learning • Lend itself to a variety of statistical analyses
Why base a stats course on baseball? • Great American game • Great historical tradition. • Statistics are a integral part of baseball, used to rate players and teams. • Players are known by their statistics (60, 56, 1.12) • Relatively easy to model using probability.
MATH 115 b • Special section of MATH 115 with a baseball emphasis • I’ve taught it several times, most recently this summer. • Text: Albert, Teaching Statistics Using Baseball, Mathematical Association of America.
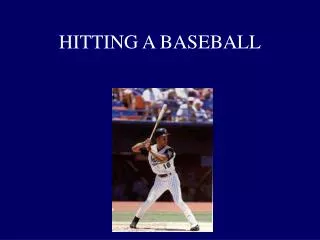
Getting started with data analysis • Looked at Bernie Williams’ baseball card. • Started with a question “Was Bernie a big home run hitter?” • Used graphs to answer the question.
Great home run hitters • Watched part of Ken Burn’s documentary about Babe Ruth. • Explored the slugging percentages of Babe. • Interesting to plot SLG against his AGE(his career trajectory) • Notice a familiar pattern. • Interesting outlier (the bellyache heard around the world)
Do all players show a similar trajectory? • Look at Barry Bonds’ slugging percentages over time. • Shows unusual pattern towards the end of his career.
Baseball shapes • Counts of things, like home run counts tend to be right-skewed. • Derived baseball stats tend to be symmetric.
The Babe, Roger, and Barry • Watched part of the movie “61*” • Compared the home run rates of players in 1921, 1961, 2001 • Which outlierwas mostnotable?
The Second Best Baseball Player from BGSU? • Orel Herscheiser was the best. • Who was the 2nd best: Grant Jackson and Roger McDowell ? (Grant’s niece was in my class.) • Compared their strikeout rates. • Jackson was the better strikeout pitcher.
Fitting lines to scatterplots • Used spaghetti to fit a line to (Home run, Slugging Percentage) for Mike Piazza’s data (note the Italian connection). • Talked about the best batting measure. Is batting average or OBP better in predicting runs scored per game?
Regression effect • Suppose your favorite team has a crummy season last season. • I predict they will do better this season. • The regression effect. • Illustrate by looking at the number of wins of teams for two consecutive seasons.
Field of Dreams • Watched part of the movie. • Looked at the statistics of Shoeless Joe Jackson and Moonlight Graham. • Who was better: Ty Cobb or Shoeless Jackson? • Can you predict Jackson’s triple count for a season if you know his double count?
Introducing probability • Played a simple dice game Big League Baseball. • A single die controls the pitch (ball or strike). • Two dice control the “in play” outcome. • Simple enough you can talk about probabilities of various events (like a hit).
All-Star Baseball • Spinner game where each spinner controls the hitting outcome for a single player. • Student had a project where they constructed a spinner for a player given his career hitting statistics. • Played a spinner game in class.
The spinner game motivates inference • There is a distinction between a player's ability and his performance. An ability is an intrinsic quality of a player, say his batting talent, that we really don't know exactly. We do observe a player's performance, say his batting average for a particular season. • The objective of Statistics is to learn about a player's ability on the basis of his performance.
Suppose a player’s true on-base percentage average is .4 • Use a 10-sided die to simulate the performance of a player in 20 plate appearances. • Big distinction between his ability and his on-base performance in these games.
Do we observe chance variation in baseball? • Watched part of “Angels in the Outfield”. • Went to a Toledo Mud Hens game. Students were asked to look for lucky things that happened in the game (such as a groundball that found the right location for a hit)
Concluded with a discussion of some interesting issues in inference • Are baseball players really streaky? • Are situational statistics in baseball meaningful?(this is how players perform in different situations like Home/Away, in different months, against different pitchers, etc.)
Arguments against teaching this type of course I’ll describe five objections
“All students aren’t interested in baseball” • At BGSU, easy to fill one section with students who like baseball • Don’t need to be a baseball fan, just willing to learn some baseball and statistics.
“Baseball (game) and statistics (serious science) don’t mix” • Baseball is a serious business for players, managers and owners. • Need a proper interpretation of statistics to be a successful baseball team. • Controversy about the use of statistics – similar to the mistrust of statistics in the public area.
“The course appeals mainly to one gender” • Course does tend to attract more men. • But the course only requires a willingness to learn.“I don’t know any baseball, but my brothers played sports, and I was learning to learn.”
“Students won’t be able to think statistically in other settings” • Use baseball as the medium where students learn statistical concepts, such as learning about an ability (a parameter). • Once the concept is learned, it is relatively easy to expose students to other examples outside baseball.
“Course doesn’t cover all topics in a first statistics course” • Only topic that didn’t receive much attention was collecting data through sample surveys and designed experiments. • But could include these topics within context of baseball.
Was the course successful? • Fun for both instructor and the students. • Enthusiasm of the instructor about the material had a positive impact on learning. • Baseball is a great context for learning many statistics concepts. • Students could make sense of the statistical conclusions.
Moral of this experiment • Should explore alternative methods of teaching statistics. • In particular, explore ways of engaging students through interesting applications so they can make more sense of statistical thinking.
Some references • “A Baseball Statistics Class”, Journal of Statistics Education http://www.amstat.org/publications/jse/v10n2/albert.html • I created a blog of my recent class.http://bstats.blogspot.com/ • See my website http://bayes.bgsu.edu for more information about the book.