Baseball Statistics: Just for Fun!
This study explores the relationships between home runs, strikeouts, walks, and stolen bases among players in the Korea Baseball Organization (KBO) and Major League Baseball (MLB). Using regression analysis and hypothesis testing, we investigate key metrics to determine if home run hitters experience more strikeouts, struggle with stolen bases, and garner more walks. The models test the significance of various slopes and control for at-bats to avoid spurious correlations. Results reveal patterns that challenge conventional wisdom about power hitters.

Baseball Statistics: Just for Fun!
E N D
Presentation Transcript
Issues, Theory, and Data Home Run hitters: more strikeouts and four balls, and less steals? Hypothesis Korea Baseball Organization and US Major League Home Pages Data collection y1=#strikeouts,y2=#steals,y3=#4Bs, x=#HRs. Regress y on constant, x. Model Hypothesis Testing Test the statistical significance of regression slopes using t-tests.
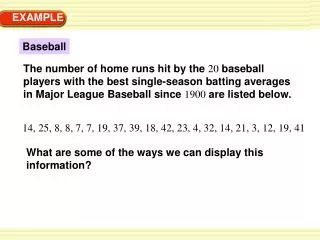
2. Data Collection KBO http://www.koreabaseball.or.kr US Major League Baseball http://www.majorleaguebaseball.com
3. Model I (#strike outs) = 1 + 1(#HRs) +
3. Model II (#steals made) = 2 + 2(#HRs) + (#steals attempted) = 3 + 3(#HRs) +
3. Model III (# four balls) = 4 + 4(#HRs) +
4. Hypothesis Testing • t-test on Significant 4= ?? 1= ?? 1 = 0.84 t-value = 2.89 4 = 0.51 t-value = 2.50 Insignificant 2, 3= ?? 2 = -0.12 3 = -0.18 t-value = -0.94 t-value =-1.14
4. Hypothesis Testing (1) HR hitters get more strike outs! (2) HR hitter does not well steal a base because of his big body. Insignificant (3) HR hitters pull out more four balls!
Wait a minute! To prevent “spurious correlation” between #HRs and #strike-outs, #steals, #4Balls, we need to control for the number of appearance at the batter box.Right!
Multiple Regression–control for “#at bats”- • Without “control for # at bats,” a hitter with more appearances would record a higher number in each category than others, generating “spurious correlation between any pair of variables among #HRs, #strike-outs, #steals, and #four balls. • Two ways of control for # at batter box • Use a subsample of hitters who appeared more than 100. • Use “# at bats” as a control variable in multiple regression.
Model I (extended) (#strike outs) = 1 + 1(#HRs) + 2(#at bats)
Results using sub-sample 1 = 0.84 (2.89) 1 = 0.89 (2.88) 2= -0.03 (-0.49) 1 = 2.40 (11.64) 1 = 0.63 (3.11) 2= 0.14 (12.53) using entire sample
Interpretation sub-sample 1 = 0.84 (2.89) 1 = 0.89 (2.88) 2= -0.03 (-0.49) When using a sub-sample which is already rather homogeneous in terms of number at bats, it doesn’t make much diference whether you control for # at bats or not. However, when using the entire sample which comprises of hitters vastly differing in terms of number at bats, control for # at bats does matter. In this entire sample, you would get distorted results if you do not control for # at bats. 1 = 2.40 (11.64) 1 = 0.63 (3.11) 2= 0.14 (12.53) entire sample
Model II (extended) (#4Balls) = 1 + 1(#HRs) + 2(#at bats)
Results sub-sample 1 = 0.51 (2.50) 1 = 0.34 (1.71) 2= 0.12 (2.77) 1 = 1.32 (11.01) 1 = 0.33 (2.73) 2= 0.07 (11.51) entire sample
The End Was it fun?