Cluster Analysis: Basic Concepts and Algorithms
Cluster Analysis: Basic Concepts and Algorithms. Jieping Ye Department of Computer Science & Engineering Arizona State University. Source: Introduction to data mining, by Tan, Steinbach, and Kumar . Outline of lecture. What is cluster analysis? Clustering algorithms


Cluster Analysis: Basic Concepts and Algorithms
E N D
Presentation Transcript
Cluster Analysis: Basic Concepts and Algorithms Jieping Ye Department of Computer Science & Engineering Arizona State University Source: Introduction to data mining, by Tan, Steinbach, and Kumar
Outline of lecture • What is cluster analysis? • Clustering algorithms • Measures of Cluster Validity
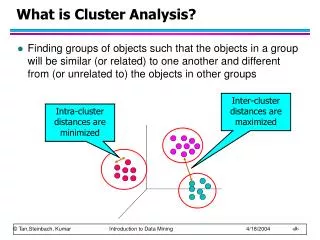
Inter-cluster distances are maximized Intra-cluster distances are minimized What is Cluster Analysis? • Finding groups of objects such that the objects in a group will be similar (or related) to one another and different from (or unrelated to) the objects in other groups
Applications of Cluster Analysis • Understanding Group genes and proteins that have similar functionality, or group stocks with similar price fluctuations • Summarization • Reduce the size of large data sets Clustering precipitation in Australia
How many clusters? Six Clusters Two Clusters Four Clusters Notion of a Cluster can be Ambiguous
Types of Clusterings • A clustering is a set of clusters • Important distinction between hierarchical and partitionalsets of clusters • Partitional Clustering • A division data objects into non-overlapping subsets (clusters) such that each data object is in exactly one subset • Hierarchical clustering • A set of nested clusters organized as a hierarchical tree
A Partitional Clustering Partitional Clustering Original Points
Hierarchical Clustering Traditional Hierarchical Clustering Traditional Dendrogram
Clustering Algorithms • K-means • Hierarchical clustering • Graph based clustering
K-means Clustering • Partitional clustering approach • Each cluster is associated with a centroid (center point) • Each point is assigned to the cluster with the closest centroid • Number of clusters, K, must be specified • The basic algorithm is very simple
K-means Clustering – Details • Initial centroids are often chosen randomly. • Clusters produced vary from one run to another. • The centroid is (typically) the mean of the points in the cluster. • ‘Closeness’ is measured by Euclidean distance, cosine similarity, correlation, etc. • K-means will converge for common similarity measures mentioned above. • Most of the convergence happens in the first few iterations. • Often the stopping condition is changed to ‘Until relatively few points change clusters’ • Complexity is O( n * K * I * d ) • n = number of points, K = number of clusters, I = number of iterations, d = number of attributes
Optimal Clustering Sub-optimal Clustering Two different K-means Clusterings Original Points
Problems with Selecting Initial Points • If there are K ‘real’ clusters then the chance of selecting one centroid from each cluster is small. • Chance is relatively small when K is large • If clusters are the same size, n, then • For example, if K = 10, then probability = 10!/1010 = 0.00036 • Sometimes the initial centroids will readjust themselves in ‘right’ way, and sometimes they don’t • Consider an example of five pairs of clusters
Solutions to Initial Centroids Problem • Multiple runs • Helps, but probability is not on your side • Sample and use hierarchical clustering to determine initial centroids • Select more than k initial centroids and then select among these initial centroids • Select most widely separated • Bisecting K-means • Not as susceptible to initialization issues
Evaluating K-means Clusters • Most common measure is Sum of Squared Error (SSE) • For each point, the error is the distance to the nearest cluster • To get SSE, we square these errors and sum them. • x is a data point in cluster Ci and mi is the representative point for cluster Ci • can show that micorresponds to the center (mean) of the cluster • Given two clusters, we can choose the one with the smaller error • One easy way to reduce SSE is to increase K, the number of clusters • A good clustering with smaller K can have a lower SSE than a poor clustering with higher K
Limitations of K-means • K-means has problems when clusters are of differing • Sizes • Densities • Non-globular shapes • K-means has problems when the data contains outliers. • The number of clusters (K) is difficult to determine.
Hierarchical Clustering • Produces a set of nested clusters organized as a hierarchical tree • Can be visualized as a dendrogram • A tree like diagram that records the sequences of merges or splits
Strengths of Hierarchical Clustering • Do not have to assume any particular number of clusters • Any desired number of clusters can be obtained by ‘cutting’ the dendogram at the proper level • They may correspond to meaningful taxonomies • Example in biological sciences (e.g., animal kingdom, phylogeny reconstruction, …)
Hierarchical Clustering • Two main types of hierarchical clustering • Agglomerative: • Start with the points as individual clusters • At each step, merge the closest pair of clusters until only one cluster (or k clusters) left • Divisive: • Start with one, all-inclusive cluster • At each step, split a cluster until each cluster contains a point (or there are k clusters) • Traditional hierarchical algorithms use a similarity or distance matrix • Merge or split one cluster at a time
Agglomerative Clustering Algorithm • More popular hierarchical clustering technique • Basic algorithm is straightforward • Compute the proximity matrix • Let each data point be a cluster • Repeat • Merge the two closest clusters • Update the proximity matrix • Until only a single cluster remains • Key operation is the computation of the proximity of two clusters • Different approaches to defining the distance between clusters distinguish the different algorithms
p1 p2 p3 p4 p5 . . . p1 p2 p3 p4 p5 . . . Starting Situation • Start with clusters of individual points and a proximity matrix Proximity Matrix
C1 C2 C3 C4 C5 C1 C2 C3 C4 C5 Intermediate Situation • After some merging steps, we have some clusters C3 C4 Proximity Matrix C1 C5 C2
C1 C2 C3 C4 C5 C1 C2 C3 C4 C5 Intermediate Situation • We want to merge the two closest clusters (C2 and C5) and update the proximity matrix. C3 C4 Proximity Matrix C1 C5 C2
After Merging C2 U C5 • The question is “How do we update the proximity matrix?” C1 C3 C4 C1 ? ? ? ? ? C2 U C5 C3 C3 ? C4 ? C4 Proximity Matrix C1 C2 U C5
p1 p2 p3 p4 p5 . . . p1 p2 p3 p4 p5 . . . How to Define Inter-Cluster Similarity Similarity? • MIN • MAX • Group Average • Distance Between Centroids Proximity Matrix
p1 p2 p3 p4 p5 . . . p1 p2 p3 p4 p5 . . . How to Define Inter-Cluster Similarity • MIN • MAX • Group Average • Distance Between Centroids Proximity Matrix
p1 p2 p3 p4 p5 . . . p1 p2 p3 p4 p5 . . . How to Define Inter-Cluster Similarity • MIN • MAX • Group Average • Distance Between Centroids Proximity Matrix
p1 p2 p3 p4 p5 . . . p1 p2 p3 p4 p5 . . . How to Define Inter-Cluster Similarity • MIN • MAX • Group Average • Distance Between Centroids Proximity Matrix
p1 p2 p3 p4 p5 . . . p1 p2 p3 p4 p5 . . . How to Define Inter-Cluster Similarity • MIN • MAX • Group Average • Distance Between Centroids Proximity Matrix
1 2 3 4 5 Cluster Similarity: MIN (Single Link) • Similarity of two clusters is based on the two most similar (closest) points in the different clusters • Determined by one pair of points, i.e., by one link in the proximity graph.
1 2 3 4 5 Cluster Similarity: MAX (Complete Linkage) • Similarity of two clusters is based on the two least similar (most distant) points in the different clusters • Determined by all pairs of points in the two clusters
1 2 3 4 5 Cluster Similarity: Group Average • Proximity of two clusters is the average of pairwise proximity between points in the two clusters. • Need to use average connectivity for scalability since total proximity favors large clusters
Hierarchical Clustering: Group Average • Compromise between Single and Complete Link • Strengths • Less susceptible to noise and outliers • Limitations • Biased towards globular clusters
Hierarchical Clustering: Time and Space requirements • O(N2) space since it uses the proximity matrix. • N is the number of points. • O(N3) time in many cases • There are N steps and at each step the size, N2, proximity matrix must be updated and searched • Complexity can be reduced to O(N2 log(N) ) time for some approaches
Hierarchical Clustering: Problems and Limitations • Once a decision is made to combine two clusters, it cannot be undone • No objective function is directly minimized • Different schemes have problems with one or more of the following: • Sensitivity to noise and outliers (MIN) • Difficulty handling different sized clusters and non-convex shapes (Group average, MAX) • Breaking large clusters (MAX)
Measures of Cluster Validity • Numerical measures that are applied to judge various aspects of cluster validity, are classified into the following three types. • External Index: Used to measure the extent to which cluster labels match externally supplied class labels. • Entropy • Internal Index: Used to measure the goodness of a clustering structure without respect to external information. • Sum of Squared Error (SSE) • Relative Index: Used to compare two different clusterings or clusters. • Often an external or internal index is used for this function, e.g., SSE or entropy • Sometimes these are referred to as criteria instead of indices • However, sometimes criterion is the general strategy and index is the numerical measure that implements the criterion.
Internal Measures: SSE • Clusters in complicated figures aren’t well separated • Internal Index: Used to measure the goodness of a clustering structure without respect to external information • SSE is good for comparing two clusterings or two clusters (average SSE). • Can also be used to estimate the number of clusters.
Internal Measures: Cohesion and Separation • Cluster Cohesion: Measures how closely related are objects in a cluster • Example: SSE • Cluster Separation: Measure how distinct or well-separated a cluster is from other clusters • Example: Squared Error • Cohesion is measured by the within cluster sum of squares (SSE) • Separation is measured by the between cluster sum of squares • Where |Ci| is the size of cluster i
Internal Measures: Cohesion and Separation • Example: SSE • BSS + WSS = constant m 1 m1 2 3 4 m2 5 K=1 cluster: K=2 clusters:
Internal Measures: Cohesion and Separation • A proximity graph based approach can also be used for cohesion and separation. • Cluster cohesion is the sum of the weight of all links within a cluster. • Cluster separation is the sum of the weights between nodes in the cluster and nodes outside the cluster. cohesion separation
Internal Measures: Silhouette Coefficient • Silhouette Coefficient combine ideas of both cohesion and separation, but for individual points, as well as clusters and clusterings • For an individual point, i • Calculate a = average distance of i to the points in its cluster • Calculate b = min (average distance of i to points in another cluster) • The silhouette coefficient for a point is then given by s = 1 – a/b if a < b, (or s = b/a - 1 if a b, not the usual case) • Typically between 0 and 1. • The closer to 1 the better. • Can calculate the Average Silhouette width for a cluster or a clustering
Final Comment on Cluster Validity “The validation of clustering structures is the most difficult and frustrating part of cluster analysis. Without a strong effort in this direction, cluster analysis will remain a black art accessible only to those true believers who have experience and great courage.” Algorithms for Clustering Data, Jain and Dubes