Download
1 / 20
200 likes | 483 Vues
Weeds, Flowers, Clutter and a New Approach to Removing the Spectroscopic Bottleneck in Millimeter and Submillimeter Astrophysical Spectra - A Discussion Frank C. De Lucia Ivan Medvedev Department of Physics Ohio State University National Radio Astronomical Observatory Charlottesville, VA

E N D
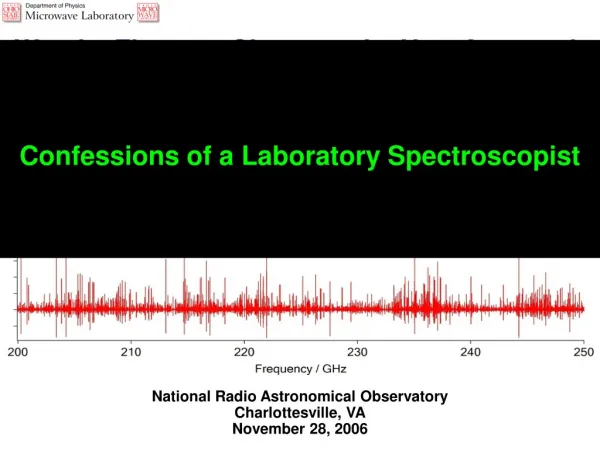
Weeds, Flowers, Clutter and a New Approach to Removing the Spectroscopic Bottleneck in Millimeter and Submillimeter Astrophysical Spectra - A Discussion Frank C. De Lucia Ivan Medvedev Department of Physics Ohio State University National Radio Astronomical Observatory Charlottesville, VA November 28, 2006 Confessions of a Laboratory Spectroscopist
The Discussion 1. Meetings for ‘spectroscopy in support of ‘X’ are becoming popular 2. The spectroscopists’ dirty little secret: We measure, assign, and model what we can - not what you need - the catalogues are massively incomplete: Spectroscopic strategies and custom vs astrophysical advances 3. Growing consensus that conventional approach will not work: a semi-infinite job 4. An alternative: Complete, intensity calibrated spectra as a function of temperature - experiment and theory 5. Really here to discuss flowers and grand fits The integration of laboratory and astrophysical spectroscopy to detect the unobservable Large molecules emit more photons/GHz into a multiplex telescope receiver than do small molecules An example of this type of spectroscopy is called FASSST, an acronym for FAst Scan Submillimeter-wave Spectroscopic Technique developed by Dr. F. De Lucia, which has the potential to obtain needed data rapidly and with the accuracy required. . . . In this approach the entire spectrum is collected at multiple temperatures and compared with known calibration lines allowing the line strengths and energy levels to be determined.
1 mm Survey of Orion with IRAM 30-m Telescope courtesy of J. Cernicharo
U-Lines in the IRAM Survey After 50 years of submillimeter spectroscopy: >5000 ‘U’ lines ~40% of total Most attributable to large molecules -Very large number of low lying vibrational/torsional states -Many have perturbations; we often analyze the portion of the spectrum that we can or have time to -In some lab spectra assign and fit ~10000 out of 100000 lines Baseline often confusion, not noise limited courtesy of J. Cernicharo
A Few Days Work Many Years of Work The Fundamental Problem: A Brief History of Bootstrap Astrophysical Spectroscopy and Models In the beginning there were only a few astrophysical lines: H2CO, NH3, CO, . . . Laboratory mm/submm spectroscopy was ahead of the astronomy Then there were U-lines - exotic species like HCO+ Astrophysical reality made it easy in the lab: Small Molecules: Astrophysically abundant and spectroscopically strong (good partition function) Also, easy to characterize in lab: ‘simple’ models were ‘complete’ -> generate ‘complete’ catalogues But then along came methanol, methyl formate, and others: Spectral complexity is a very steep function of molecular size The difficulty of complete spectroscopic modeling is also a very steep function of molecular size
Stated Another Way In the beginning it was easier to model/predict line frequencies than to measure them Small, easy to model species - measure a few well selected transitions, predict the rest As an important by-product, these models gave astronomers intensities As an additional by-product, this led naturally to catalogues based on these models Now it is easier to measure spectra than to predict them Orders of magnitude increase in the difficulty of modeling (large molecules) Improvements in experimental approaches Our cataloging strategy does not reflect this change Catalogues have become very incomplete in unpredictable ways - unknown bounds But even with experimentally measured spectral frequencies, we have to deal with the intensity/temperature problem
Methyl Formate We spent a lot of time assigning these A and E ground state lines (which have 10 - 20% of the total intensity), and they don’t have much in the way of perturbations
Non-Bootstrap Approach: Measure every line
FASSST Spectrum of the Classical Weed: Methyl Formate < 0.01 second of data
BUT! 1. We rarely measure intensities 2. Even if we did, we need to know them over the range of astronomical temperatures 3. Traditional bootstrap Quantum Mechanical models do this very well
The Effect of Temperature on the Spectrum of CH3OH Observed | Calculated We need spectrum that is not just complete in frequency, but also in intensity at all temperatures
The Calculation of Line Frequencies and Intensities from Experimental Data Overview of New Approach
A MOLECULAR LINE SURVEY OF ORION KL IN THE 350 MICRON BAND C. Comito, P. Schilke, T. G. Phillips, D. C. Lis, F. Motte, and D. Mehringer; Ap. J. S.S. 156, 127 (2005). Can we fit astrophysical data as opposed to simply identifying the lines? Analytical Chemistry (with intensity calibrated reference spectra): Number of data points = number of spectral resolution elements Number of molecular variables = number of molecules (their concentrations) Astrophysics: Number of astrophysical variables = ? (temperature(s)-velocity component(s), . .)
A Motivation: From Weeds to Flowers? Rotational Partition Functions At a given observational frequency: the distance between band heads is the number of K-levels associated with each band head is: the number of MJ levels associated with each K - line is: Sum of line strengths/frequency interval - the number of spectral photons available to a multi-channel telescope Because the spectral space occupied by these lines grows as R2 (the MJ factor above adds intensity, but not spectral space)
Is it possible to recover astronomical molecular concentrations without individually observable lines? Some Thoughts and Questions 1. Fit for individually identifiable ‘U’ lines and QM assigned lines. 2. Will fits to complete spectral libraries eliminate the background clutter? 3. Are there individually hidden, but collectively observable flowers in the astronomical garden? 4. Note the lineshape problems in the astrophysical spectrum - how big is this impact?
Questions -> A modest Program? 1. What is the state of the art for already having done this (i.e. subtract the contributions from assigned lines) Turbulence and lineshape effects? 2. As a function of telescope/telescope type/ molecule/astronomical source, how bad is the approximation that there is an effective temperature? To drive down clutter to 20% of current level, this linear average approximation only needs to be good to a factor of 5? How well can you use the spectra from simple molecules to establish the effective temperature? Are there families of molecules which occupy similar regions inside of a spatial resolution element?
3. A simpler molecular problem? A ‘glycine-like’ molecule for which there may be individually observable lines, but lines near the clutter limit. 4. If/When ‘Complete’ Spectra become available, what might the best astronomical sources be for which to try this grand fit approach? Not too hard - Not too easy 5. Alternatives to ‘effective’ temperature Let regions within resolution element have different temperatures/velocities and use the very redundant spectral information to choose sets of concentrations/temperature Include chemistry models to link species in space (temperature and turbulence)
The Relationships Among Spectroscopy, Catalogues, and Astrophysics have Changed Dramatically and We Need a New Strategy Elimination of Weeds by use of ‘Experimental’ Models From experimental measurements at two temperatures T1 and T2, it is possible to calculate spectrum (with intensities) at an arbitrary T3. For low T3, a relatively low T2improves the accuracy of the calculated spectrum. Collisional cooling provides a general method for achieving this low T2, with 77 K convenient and suitable for all but the lowest temperatures. FASSST is a means of obtaining the needed data rapidly and with chemical concentrations constant over the data collection period. It is realistic in a finite time to produce catalogs complete enough to account even for the quasi-continua that sets the confusion limit. In the limit of ‘complete’ spectroscopic knowledge, the confusion limit will probably be set by the unknowns associated with the complexity of the astrophysical conditions, but the high spatial resolution of large telescopes and modern arrays may reduce this complexity. Finding Flowers - Understanding Chemistry and Astrophysics With good telescope intensity calibration and high spatial resolution there is a good prospect to use a global fitting approach to detect larger molecules than commonly assumed. Are analyses which include chemistry and nonlinearity of spectral signature to temperature to link concentrations/temperatures/turbulence within a spatial resolution element possible? The path laid out has challenges, but they are small in comparison to other challenges that must be met to get maximum return on investment for $109 instruments