ACTIVE GALACTIC NUCLEI
ACTIVE GALACTIC NUCLEI Optical spectral classification and Luminosity Function Introduction and some caveats Sy1/QSO QSO/quasar NLRG/QSO2/Sy2 RL QSO/RQ QSO Point-like/extended

ACTIVE GALACTIC NUCLEI
E N D
Presentation Transcript
ACTIVE GALACTIC NUCLEI Optical spectral classification and Luminosity Function
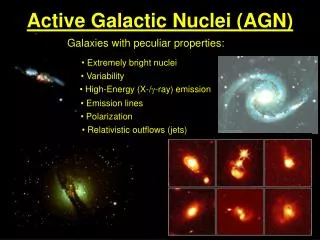
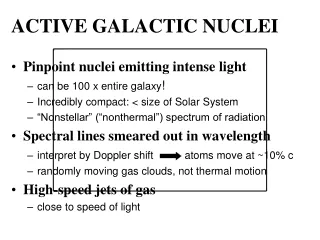
Introduction and some caveats • Sy1/QSO • QSO/quasar • NLRG/QSO2/Sy2 • RL QSO/RQ QSO • Point-like/extended ”Active galactic nuclei (AGN) are a class of galaxies where a significant fraction of the energy output, emerging from their centers, is not produced by the normal galaxy components : stars, dust and interstellar gas. This energy can be emitted across the whole electromagnetic spectrum, from radio waves to gamma rays” Reducing the AGN zoo as much as possible ! Marco Mignoli: AGN Optical Classification & Luminosity Function
The UV/optical/NIR spectrum • Power-law: emitted by an highly compact non-thermal source (power law) • Big Blue Bump: this component possibly comes from the BH accretion disk (black body) Marco Mignoli: AGN Optical Classification & Luminosity Function
The UV/optical AGN spectrum • Power-law • Big Blue Bump • Small Blue Bump: FeII+Balmer Continuum • Broad emission lines: FWHM > 1500 Km/s • Narrow emission lines: FWHM < 900 Km/s The emission lines characterize the AGN spectra: they are produced in two separate regions, a subarcsec Broad Line Region (BLR) close to the central engine, and a more extended Narrow Line Region (NLR). • Galaxy Starlight: usually overwhelmed by the AGN non-thermal continuum and emerging in the red part of the spectrum Marco Mignoli: AGN Optical Classification & Luminosity Function
The UV/optical emission line spectrum Marco Mignoli: AGN Optical Classification & Luminosity Function
What we learn from theAGN UV/optical spectra • Redshift • Classification (optical): Type 1/Type 2 • AGN Unification: evidences • Physical state of the emitting-line gas • AGN/StB separation: Diagnostic Diagrams • Unconventional AGNs Marco Mignoli: AGN Optical Classification & Luminosity Function
Redshift • Discovery of the true nature of quasar • Cosmological Distance • Absolute physical quantities (L,M,size) • Only the optical spectrum (sometimes UV, near-IR) gives z • Easy way to measure z Marco Mignoli: AGN Optical Classification & Luminosity Function
In 1963 Schmidt identifies highly redshifted Balmer lines in 3C273’s spectrum z = 0.158 (vr = 47500 km/s) Marco Mignoli: AGN Optical Classification & Luminosity Function
Redshift • Discovery of the true nature of quasar • Cosmological Distance • Absolute physical quantities (L,M,size) • Only the optical spectrum (sometimes UV, near-IR) gives z • Easy way to measure z Marco Mignoli: AGN Optical Classification & Luminosity Function
AGN emission line spectra • Type 1 AGNare those with very broad optical/UV permitted emission lines, with FWHM~1500-15000 km/s, while the forbidden lines, like [OII]3727, [OIII]4959/5007, [NII]6548/6583, typically have FWHMs of order of 500-1000 km/s. • Type 2 AGN have permitted and forbidden lines with approximately the same FWHM, similar to the FWHMs of the forbidden lines in Type 1 objects. The forbidden lines, while narrower than the permitted ones, are usually broader than the emission lines in most starburst galaxies. Optical Type 1 Optical Type 2 Marco Mignoli: AGN Optical Classification & Luminosity Function
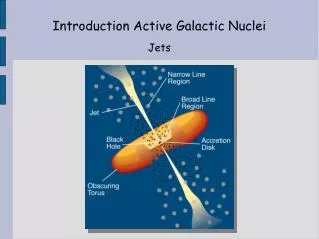
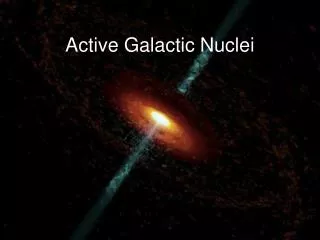
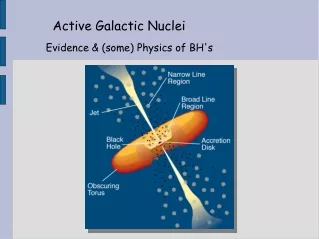
AGN Unification: the “standard model” Components: Accretion Disk: r ~ 10−3pcn ~ 1015cm−3v~ 0.3c Broad Line Region: r ~ 0.01−0.1 pcn ~ 1010cm−3v ~ few x 103km s−1 Dusty Torus: r ~ 1−100 pcn ~ 103 −106 cm−3 Narrow Line Region: r ~ 100−1000 pcn ~ 102 −104cm−3v ~ few x 102km s−1 Marco Mignoli: AGN Optical Classification & Luminosity Function
AGN Unification: the paradigm “... Much of the variety in AGN types isjust the result of varying orientation relative to the line of sight. [...] We can define an extreme hypothesis in which there are only two basic AGN types: the radio quiet and radio loud.” (Antonucci 1993) XBONG Marco Mignoli: AGN Optical Classification & Luminosity Function
Spectral classification (em.lines) • Type 1 • Type 2 • Starforming galaxies Marco Mignoli: AGN Optical Classification & Luminosity Function
Spectral classification (em.lines) • Type 1 • Type 2 • Starforming galaxies How we can discriminate the narrow line objects? Marco Mignoli: AGN Optical Classification & Luminosity Function
Spectral classification (em.lines) SDSS DIAGNOSTIC DIAGRAM • Sy 1 galaxies • Sy 2 galaxies • Starforming galaxies • Composite galaxies Marco Mignoli: AGN Optical Classification & Luminosity Function
Diagnostic Diagrams SDSS • Sy2/StB theoretical separation Kewley et al. (1991) Marco Mignoli: AGN Optical Classification & Luminosity Function
Diagnostic Diagrams SDSS • Sy2/StB empirical separation Kauffmann et al. (1994). Marco Mignoli: AGN Optical Classification & Luminosity Function
Diagnostic Diagrams The BPT diagrams (Balwin, Phillips & Terlevich 1981, Veilleux & Ostrebrock 1987),are usedin narrow-line emission systems, to distinguish between the origins of the photo-ionization, hard and soft radiation, which is usually ascribed to non-stellar and stellar activity, respectively. The general criterium [O III] / Hβ > 3 could be wrong ! Shock-heated Power-law Sey2 Planetary nebulae LINERs H II gal H II galaxies (BPT 1981)(Peterson 1997) Marco Mignoli: AGN Optical Classification & Luminosity Function
Diagnostic Diagrams DIAGNOSTIC DIAGRAMS Em.lines in the red range • [NIII]6584/Hα vs. [OIII]5007/Hβ • [SII]6717-31/Hα vs. [OIII]5007/Hβ • [OI]6300/Hα vs. [OIII]5007/Hβ Em.lines in the blue range • [OII]3727/Hβ vs. [OIII]5007/Hβ • [OII]3727/Hβ vs. continuum index Other line ratios in UV, NIR andFIR spectral ranges NV1240/Lyα, NV1240/HeII1640, CIV /Lyα [Si VI] 1.962μm/Paα [NeV]14μm/[NeII]12.8μm, [OIV]26μm/[NeII]12.8μm, EW(PAH 7.7μm) Marco Mignoli: AGN Optical Classification & Luminosity Function
AGN taxonomy: LINERs LINER= Low-Ionization Narrow-Line Region They are characterized by [O II] λ3727Å / [O III] λ5007Å ≥ 1 [O I] λ6300Å / [O III] λ5007Å ≥ 1/3 Most of the nuclei of nearby galaxies are LINERs. A census of the brightest 250 galaxies in the nearby Universe shows that 50–75% of giant galaxies have some weak LINER activity(Phillips et al. 1986, Ho, Filippenko & Sargent 1993, …). They are the weakest form of activity in the AGN zoo. (Heckman 1980) Marco Mignoli: AGN Optical Classification & Luminosity Function
AGN taxonomy: BAL QSOs BAL QSOs= Broad Absorption Line QSOs Otherwise normal QSOs that show deep broad absorption lines, blueward of the corresponding emission resonance lines of CIV, SiIV, NV. The interpre-tation is that they are intrinsic and arise from clouds outflowing the nucleus. They mainly are at z ≥ 1.5 because the phenomenon is observed in the rest-frame UV. At these redshifts, they are ~10% of the observed population. Mean QSO spectrum PG 0946+301. Arav et al. (1999) Marco Mignoli: AGN Optical Classification & Luminosity Function
AGN taxonomy: BL Lacs & Blazars • BL Lacertaeis the prototype of this class: an object, stellar in appearance, with very weak emission lines and variable, intense and highly polarized continuum. The weak lines often just appear in the most quiescent stages. BL Lacs, along with optically violent-variable (OVV) QSOs, constitute the class of Blazars: these are believed to be objects with a strong relativistically beamed jet in the line of sight. Marco Mignoli: AGN Optical Classification & Luminosity Function
AGN taxonomy: XBONGs XBONGs= X-rayBrightOpticallyNormalGalaxies This AGN class consists of luminous hard X-ray sources hosted by "normal" galaxies with optical spectra typical of early-type systems (Comastri et al. 2002). Why the relatively bright X-ray emission, typical of moderately luminous (1042-43 erg s-1) Active Galactic Nuclei , does not leave any optical signature of the presence of a nuclear source is still matter of debate. Marco Mignoli: AGN Optical Classification & Luminosity Function
AGN taxonomy: XBONGs • The upper limits on the optical emission lines ([OIII], Hα), expected from the nuclear activity, in some XBONGs are tight enough to place these sources outside the typical AGN properties. • Possible interpretations: • Dilution from the host galaxy light • Radiatively inefficient accretion flow • Heavy obscuration by Compton-thick nuclear gas • NLR obscured on galaxy scale (i.e., Kpc dust lanes, see Malkan et al. 1998, Rigby et al. 2006) • Extreme BL Lacs objects Hellas2XMM Marco Mignoli: AGN Optical Classification & Luminosity Function
AGN taxonomy: the type-2 QSOs Definition: “Quasar (high L) analogue of Sy2 galaxies” OPTICAL:high bolometric luminosity (→ high z) objects with high ionization, narrow (FWHM<1500km/s) emission lines, no broad lines. (expected according to the Unification models of AGN) X-RAYS: high-luminosity (Lx> 1044 erg/cm/s2) and obscured (NH>1022cm-2) AGN (required by XRB synthesis models). Do obscured (type II) quasars exist? To date, only a small number of candidates have been found (but NLRG). First examples did not confirm their classification after follow-up observations (high S/N and/or redward). Marco Mignoli: AGN Optical Classification & Luminosity Function
AGN taxonomy: the type-2 QSOs Boyle et al. (1999) Type2 Without the low order Balmer lines, a secure type2 classification is a moot point. Halpern et al. (1999) Type 1 Marco Mignoli: AGN Optical Classification & Luminosity Function
AGN taxonomy: the type-2 QSOs The high-z type-2 QSOs do exist! Selected both in optical, X-rays and FIR. But they are demanding targets for optical spectroscopy. (but see SDSS…) Stern et al. (2002) Norman et al. (2002) Martinez-Sansigre et al. (2005) Marco Mignoli: AGN Optical Classification & Luminosity Function
The “redshift desert” for type-2 QSOs Redhift desert (1.4<z<2) High-z range Low-z range Marco Mignoli: AGN Optical Classification & Luminosity Function
Optical spectra of different AGN types Marco Mignoli: AGN Optical Classification & Luminosity Function
Points to Take Away (1) • The optical spectrum offers a wealth of information about BLR/NLR and the AGN structure, but it is mainly composed by “secondary” radiations. • The unification scheme is a clear and simple way to classify AGN, but don’t tell us all the truth. ty1/ty2 ↔ f(L),f(z),f(λ),f(env),f(host-type),f(t) • Multi-wavelength approach to AGN study Marco Mignoli: AGN Optical Classification & Luminosity Function
Marco Mignoli: AGN Optical Classification & Luminosity Function
The Luminosity Function • To study galaxy/AGN evolution we need to compare extragalactic objects today with the same kind of objects in the past • To perform a fair comparison we need to compare the emitted power at the same wavelengths, hence K-corrections [k(z)] • We cannot observe the same galaxy at different times, so we must look at the statistical properties as populations, hence we study Luminosity Functions (LF) Marco Mignoli: AGN Optical Classification & Luminosity Function
The Luminosity Function • The luminosity function characterises the number density of (active) galaxies as a function of the luminosity L • Luminosity function, usually written (L), is defined as the co-moving number density (number of objects per co-moving volume) in some luminosity range (usually logarithmic) Marco Mignoli: AGN Optical Classification & Luminosity Function
The Luminosity Function • In order to allow easy comparison between different determinations and different types of LF it is usual to use simple parameterisations • Schecter common for galaxies • Two-Power-Law common for AGN • Power-Law with exponential cut-off infrared galaxies Marco Mignoli: AGN Optical Classification & Luminosity Function
Power-Law slope a * Log((L)) L* Log (Luminosity) LF: Schecter Function (for galaxies) Exponential Cut-off Marco Mignoli: AGN Optical Classification & Luminosity Function
* Log((L)) L* Log (Luminosity) Parametric Evolution of Luminosity Functions Pure density evolution Density Evolution Pure Luminosity evolution Luminosity Evolution Marco Mignoli: AGN Optical Classification & Luminosity Function
Density Evolution * Log((L)) Luminosity Evolution L* Log (Luminosity) Parametric Evolution of Luminosity Functions Marco Mignoli: AGN Optical Classification & Luminosity Function
Luminosity Function: methods of calculation LF is just the number density of galaxies… … so just have to count the number of galaxies... … and divide by the observable volume of each one. … simple but .... Only complication is the magnitude limits of the survey • 1/Vmax (move the galaxy) Move the galaxy forwards and backwards in redshift, to find the maximum volume it could have inhabited and still been observed. • Maximum likelihood (change its brightness) At a fixed redshift, what is the range of luminosities that a galaxy could have - and still be observed… need to assume a form for the LF. Marco Mignoli: AGN Optical Classification & Luminosity Function
The QSO LF: goals • The optical luminosity functions of quasars (OLF), as well as different types of AGN, hold important clues about the demographics of the AGN population, providing strong constraints on physical models and evolutionary theories of AGN. • The QSO OLF at high redshifts provides important constraints on the ionizing UV radiation field of the early universe. • The faint end of the QSO LF has not been measured at high redshift until now. Instead, low-z measurements of the faint end were combined with high-z measurements of the bright end to estimate the entire LF at high z. • The luminosity function of quasars is one of the principal constraints on the accretion history of the most massive black holes Marco Mignoli: AGN Optical Classification & Luminosity Function
The QSO LF: goals • Derive the density of AGNs as function of bolometric luminosity, redshift (Lbol | z |type) • Relates to: • Characterizing accretion history: • Distribution functions of black hole activity as function of MBH, accrection rate and radiative efficiency and redshift • Probing galaxy/BH coevolution • Test unification model Marco Mignoli: AGN Optical Classification & Luminosity Function
The QSO LF: basic issues Instead of (Lbol| z | type), we observe: • N(f, z, AGN type, selection criteria) • Selection effect • Incompleteness due to selection criteria (correctable) • Selection bias (e.g., optical survey missing obscured sources) • Bolometric correction • Redshift effect • Flux-limited vs. volume limited, truncated data set • Limited luminosity range at any given redshift • K-correction Marco Mignoli: AGN Optical Classification & Luminosity Function
Accretion history of AGNs Quasar space density as a function of redshift. Marco Mignoli: AGN Optical Classification & Luminosity Function
Luminosity function describes the space number density of AGNs with luminosity L at redshift z. The black hole mass density accreted in bright AGN phases is where is the AGN luminosity function, is radiation efficiency. Accretion history and luminosity function of AGNs Marco Mignoli: AGN Optical Classification & Luminosity Function
The local black hole mass density can be estimated from the optical data by using relation (Yu & Tremaine 2002, Marconi et al. 2004): Black hole mass density and the OLF of AGNs Local black hole mass density mainly comes from the accretion during bright AGN phases. Marco Mignoli: AGN Optical Classification & Luminosity Function
Formation history of the SMBHs: mass density • Total accreted mass (hence BH mass density) can be estimated by LF assuming the mass-to-energy conversion factorε(Soltan 1982). • Compare with a local BH mass density estimated from the relation between BH mass and velocity dispersion to constrain ε. • Previous studies: • Fabian and Iwasawa (1999) , Elvis et al (2002): use the XRB intensity assuming z=2 for all the XRB source • Yu and Tremaine (2002) use the QSO optical LF from 2dF survey • Marconi et al. (2004) use both the XRB and SDDS data (galaxies & quasars) Marco Mignoli: AGN Optical Classification & Luminosity Function
1. Birth of AGNs Major mergers between galaxies trigger nuclear gas flows to feed the BH, and trigger nuclear starbursts. The nucleus is obscured by dense gas. 2. Bright AGN phase Accreting at around or slightly less than the Eddington rate. The gas becomes transparent and the nucleus can be seen. 3. Death of bright AGNs Radiation of AGNs expels gases to quench both BH accretion and star formation. 4. Faint AGN phases Accreting at very low rates The scenario for AGN formation and evolution Marco Mignoli: AGN Optical Classification & Luminosity Function
The QSO LF: Parameterization • Quasar LF: double power-law • Luminosity-dependent density evolution (Schmidt and Green 1983): (L,z) = (L,z) (L,z=0) Overall density evolves; Shape (bright and faint end slopes) evolves as well Marco Mignoli: AGN Optical Classification & Luminosity Function
2QZ QSO Luminosity Function from 2dF Quasar Survey www.2dfquasar.org Marco Mignoli: AGN Optical Classification & Luminosity Function
3 Lya 2 CIV CIII MgII 1 OIII 0 4000 Åobserved wavelength8000 Å redshift
Properties of the 2dF Quasar Survey • Quasars selected from pointlike sources using U-B:B-R colours (UVX) • 0.3<z<2.5 • ~25000 B<21 QSOs in final catalogue • Volume probed ~4 x10⁹h-3Mpc3 www.2dfquasar.org Croom et al. 2002, MNRAS, 322, L29 Croom et al. 2004, MNRAS, 349, 1397 Marco Mignoli: AGN Optical Classification & Luminosity Function