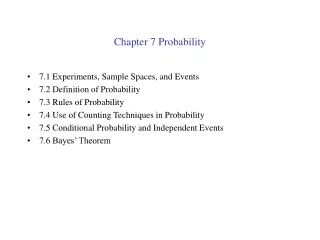
Chapter 7- Probability
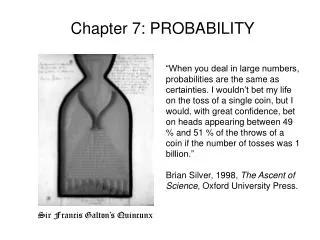
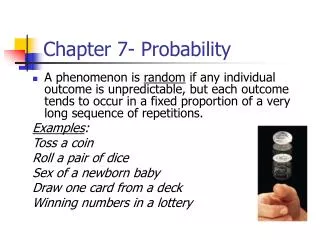
Chapter 7- Probability. A phenomenon is random if any individual outcome is unpredictable, but each outcome tends to occur in a fixed proportion of a very long sequence of repetitions. Examples : Toss a coin Roll a pair of dice Sex of a newborn baby Draw one card from a deck

Chapter 7- Probability
E N D
Presentation Transcript
Chapter 7- Probability • A phenomenon is random if any individual outcome is unpredictable, but each outcome tends to occur in a fixed proportion of a very long sequence of repetitions. Examples: Toss a coin Roll a pair of dice Sex of a newborn baby Draw one card from a deck Winning numbers in a lottery
Definitions: • The probability of any outcome of a random phenomenon is the proportion of times the outcome would occur in a very long series of repetitions. It represents the frequency of occurrence of the outcomes • The sample space S of a random phenomenon is the list of all possible outcomes. • An event is any collection of outcomes in the sample space, i.e. a subset of the sample space.
Examples: Find the sample space • Toss a coin once • Toss a coin 2 times • Toss 3 coins • Roll 1 die • Roll 2 dice: sum of the up faces/ difference of the up faces
Probability Model • A probability model is a mathematical description of a random phenomenon consisting of two parts: • A sample space S • A way of assigning probabilities to events. • Example: Rolling a die • Notation: P(E) is the probability of an event E
Probability Rules 1. The probability always satisfies 0<P(E)<1 2. The sum of the probabilities of all of the events in a sample space is 1. P(S) = 1 3. For any event E, we have P(not E) = 1 - P(E) 4. If 2 events A and B have no outcomes in common, then P(A or B) = P(A) + P (B)
Probability Models • A probability model for a finite sample space, must satisfy the following conditions: • Each outcome has a probability that is between 0 and 1 • Probabilities of all outcomes in sample space must add up to 1.
Equally Likely Outcomes • If a random experiment has k possible outcomes, all equally likely, then each individual outcome has probability 1/k. • The probability of any event E, P(E) is • Example: P(roll a sum of 6) = ?
Counting Principle • If there are m ways of doing one thing, n ways of doing a second thing, k ways of doing a third, …, then there are (m)(n)(k)…. ways of doing all three, one after the other.
Examples: Counting • Example: How many code words of length 5 can be formed that use only these letters {a,b,c,d,e,f,g,h,i}? • A combination lock will open when the right choice of three numbers (from 1 to 40) is selected. How many different lock combinations are possible? • In Arizona, each automobile license plate number consists of 3-digit numbers followed by 3 letters. How many license plate numbers can be formed?
More Examples: Probability • If the probability that Kerry gets an "A" in English class is 3/5, what is the probability that Kerry does not get an "A?" • Exactly one of three contestants will win a game show. The probability that Terry wins is 0.25 and the probability that Chris wins is 0.65. What is the probability that Toni wins? • Suppose three fair coins are tossed and the number of heads that appear is recorded. What is the probability of getting exactly two heads?
More More Examples A pizza can be made with any of the following toppings: Cheese, pepperoni, mushrooms, ham, or olives. • How many different three-topping pizzas can be made? • What is the probability that a randomly created three-topping pizza will contain NO mushrooms (It’s very important to know the answer because I don’t like mushroom) • What is the probability that a randomly created three-topping pizza will contain bacon? Pepperoni?
More More More Examples • Two dice are tossed. What is the probability that the total of the two dice is 7? • We wish to make a spinner that will be numbered 1 to 4, but will have the probability of spinning a "1" be 0.5. Draw the face for such a spinner.
The Mean of a Probability Model • Grade Average • Suppose that the possible outcomes in a sample space S are numbers, and that is the probability of the outcome . Then the mean of this probability model is
Mean: Examples • Mean household size • Gambling: Roll a die • A 6 occurs: you win $2.00 • Otherwise: you lose $1.00
Mean= Expected Value • The mean or expected value of an experiment basically tells you the overall average payoff if you play the game many times. • If you are gambling, the mean tells you about how much, on average, you are expected to win or lose each game.
Law of Large Numbers • According to the Law of Large Numbers, as the random phenomenon is repeated a large number of times, • The proportion of trials on which each outcome occurs gets closer and closer to the probability of that outcome, and • The mean x of the observed values gets closer and closer to . Random in the sense of showing long-run regularity
Roulette • A roulette wheel has 38 slots • 18 are black: odd • 18 are red: even • 2 are green:0 and 00 • A bet of $1 on red pay off an additional $1 if the ball lands in a red slot
Distribution of average winnings • A gambler’s winnings in a night of 50 bets on red in roulette vary from night to night • The distribution of many nights’ results is approximately normal
Sampling Distributions Revisited • Sampling variability is the fact that when we take repeated samples of the same size from the same population, results will vary from sample to sample. • We can represent the sampling distributions with histograms. • When examining sampling distributions, we want to look at the shape, center, and spread of the distributions
A Random Sampling Experiment • Gallup asked a sample of 1523 people, “Please tell me whether or not you bought a state lottery ticket in the past 12 months” • Number of people answered “yes” is random; or the proportion of people in the sample said “yes” is random • If we drew 1000 different samples and repeated the questions, then we would find different proportions of people who said yes By the Law of Large Number guarantees ???
Normal Curves • Normal curves are symmetric and bell-shaped with tails that fall off smoothly on either side, and have no outliers. The center of the normal curve is the center in several senses: Mean, median, center of symmetry. • A normal curve assigns probabilities to outcomes as follows: • the probability of an interval of outcomes is the area under the normal curve above that interval • The total area under any normal curve is exactly 1
Normal Distributions • The mean of a normal distribution lies at the center of symmetry of the normal curve. • The standard deviation of a normal distribution is the horizontal distance from the mean to the point on the curve where the curve goes from being curved down to being curved up. • The first quartile of a normal distribution lies .67 of a standard deviation below the mean and the third quartile lies .67 of a standard deviation above the mean
Example • Heights of young women • Mean=? • Standard Deviation=? • First Quartile = ? • Third Quartile = ?
Example • This example also shows that why we only prefer to use mean and standard deviation instead of five-number summary • Questions: • How many percents of young women are shorter than 62.8 inches? • How many percents are between 62.8 and 68.2?
68-95-99.7 Rule • In a normal distribution: • 68% of the data lies within 1 standard deviation from the mean. • 95% of the data lies within 2 standard deviations from the mean. • 99.7% of the data lies within 3 standard deviations from the mean.
The Central Limit Theorem • A sample mean or sample proportion from n trials on the same random phenomenon has a distribution that is approximately normal when n is large. • The mean of this normal distribution is the same as the mean for a single trial. • The standard deviation of this normal distribution is the standard deviation for a single trial divided by the square root of n.
Standard Deviation • Suppose that the possible outcomes • Of a sample space S are numbers and that is the probability of outcome . The variance of the probability model is • The standard deviation is the square root of the variance
Homework • #3, 5, 7, 11, 13, 17, 20 • #19-35 odd, 41, 49, 55