Download
1 / 4
40 likes | 111 Vues
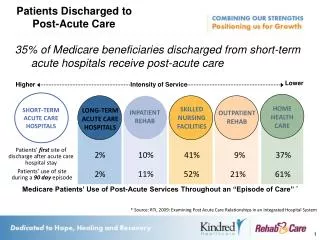
This study evaluates the opportunities available to Post-Acute Care providers who want to participate in redesigning their segment of the care continuum, specific to the Bundled Payments for Care Improvement Initiative (BPCI). We clarify how the BPCI Model 3 episodes of care are defined, the financial risk assumed by applicants, and the partnerships needed to mitigate risk by care coordination and redesign of clinical strategy. Furthermore, using data mining techniques, applied statistics, and applied contextual science, we present findings through visualizations enabling data discovery and accountability.

E N D
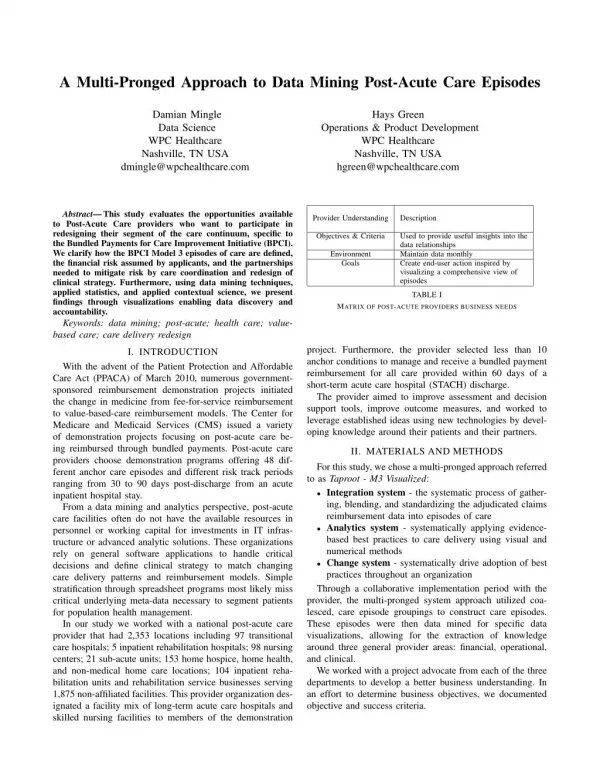
A Multi-Pronged Approach to Data Mining Post-Acute Care Episodes Damian Mingle Data Science WPC Healthcare Nashville, TN USA dmingle@wpchealthcare.com Hays Green Operations & Product Development WPC Healthcare Nashville, TN USA hgreen@wpchealthcare.com Abstract—This study evaluates the opportunities available to Post-Acute Care providers who want to participate in redesigning their segment of the care continuum, specific to the Bundled Payments for Care Improvement Initiative (BPCI). We clarify how the BPCI Model 3 episodes of care are defined, the financial risk assumed by applicants, and the partnerships needed to mitigate risk by care coordination and redesign of clinical strategy. Furthermore, using data mining techniques, applied statistics, and applied contextual science, we present findings through visualizations enabling data discovery and accountability. Keywords: data mining; post-acute; health care; value- based care; care delivery redesign Provider Understanding Description Objectives & Criteria Used to provide useful insights into the data relationships Maintain data monthly Create end-user action inspired by visualizing a comprehensive view of episodes Environment Goals TABLE I MATRIX OF POST-ACUTE PROVIDERS BUSINESS NEEDS project. Furthermore, the provider selected less than 10 anchor conditions to manage and receive a bundled payment reimbursement for all care provided within 60 days of a short-term acute care hospital (STACH) discharge. The provider aimed to improve assessment and decision support tools, improve outcome measures, and worked to leverage established ideas using new technologies by devel- oping knowledge around their patients and their partners. I. INTRODUCTION With the advent of the Patient Protection and Affordable Care Act (PPACA) of March 2010, numerous government- sponsored reimbursement demonstration projects initiated the change in medicine from fee-for-service reimbursement to value-based-care reimbursement models. The Center for Medicare and Medicaid Services (CMS) issued a variety of demonstration projects focusing on post-acute care be- ing reimbursed through bundled payments. Post-acute care providers choose demonstration programs offering 48 dif- ferent anchor care episodes and different risk track periods ranging from 30 to 90 days post-discharge from an acute inpatient hospital stay. From a data mining and analytics perspective, post-acute care facilities often do not have the available resources in personnel or working capital for investments in IT infras- tructure or advanced analytic solutions. These organizations rely on general software applications to handle critical decisions and define clinical strategy to match changing care delivery patterns and reimbursement models. Simple stratification through spreadsheet programs most likely miss critical underlying meta-data necessary to segment patients for population health management. In our study we worked with a national post-acute care provider that had 2,353 locations including 97 transitional care hospitals; 5 inpatient rehabilitation hospitals; 98 nursing centers; 21 sub-acute units; 153 home hospice, home health, and non-medical home care locations; 104 inpatient reha- bilitation units and rehabilitation service businesses serving 1,875 non-affiliated facilities. This provider organization des- ignated a facility mix of long-term acute care hospitals and skilled nursing facilities to members of the demonstration II. MATERIALS AND METHODS For this study, we chose a multi-pronged approach referred to as Taproot - M3 Visualized: • Integration system - the systematic process of gather- ing, blending, and standardizing the adjudicated claims reimbursement data into episodes of care • Analytics system - systematically applying evidence- based best practices to care delivery using visual and numerical methods • Change system - systematically drive adoption of best practices throughout an organization Through a collaborative implementation period with the provider, the multi-pronged system approach utilized coa- lesced, care episode groupings to construct care episodes. These episodes were then data mined for specific data visualizations, allowing for the extraction of knowledge around three general provider areas: financial, operational, and clinical. We worked with a project advocate from each of the three departments to develop a better business understanding. In an effort to determine business objectives, we documented objective and success criteria.
A. Data sources The post-acute provider received over 12 comma-separated (CSV) files monthly from the CMS. The provider collapsed these files to construct care episodes for post-acute patients by selected diagnosis-related groupers (DRGs) representing the pre-selected anchor conditions for management. The care episode construct also contained the patient’s cost, which in this case was the payment amount for all services during the risk bearing period post-acute care stay discharge. The ser- vices costs in the care episode included all Medicare Part A and B services plus any short-term acute care readmissions. B. Pre-processing the data To complete the integration step, the first step in the multi-pronged system approach, the providers synthesized the care episode construct files into a data repository capable of linking all data attributes from each of the sourced care episode files. As part of our process we described the data, explored the data, and verified data quality. We conducted a volumetric analysis of data where we documented the format of the data, the quantities of the data, and the number of fields in each table as well as any other surface features that were discovered. We did this to be sure that the data acquired satisfied the relevant requirements from the provider. During the exploring aspect of the data, we investigated key attribute relationships between pairs or small numbers of attributes, results of simple aggregations, properties of significant sub-populations, and simple statistical analyses. We found that in many cases the data mining goals of the provider were answered with this level of analysis. We found that in the case of data quality it presented itself as complete and addressed the outstanding questions for the provider. However, we did encounter errors, though they were infrequent. In addition, we uncovered missing values that occurred in the DRG field. They were not that common and were brought to the attention of the data aggregator to be sure their aggregation logic was sound for all known cases. Fig. 1. Learn the most impactful areas for readmissions. III. RESULTS Data mining techniques coupled with platform generated visualizations fostered the collaboration between different disciplinary representatives to better manage the demonstra- tion program. A. What we did to mine big health care data We recognized that health care as an industry lags in the adoption of technology and the implementation of effective analytic strategies often because of the complexities within health care. We aimed to uncover patterns from data stores and then used that information to inform us about the future. This was accomplished by blending the data inputs and the domain expertise of the end-users, resulting in high- quality knowledge. Using the Taproot system approach with associated visualizations, we employed the following phases to successfully mine the providers’ health care data: • Descriptive statistics • Exploratory data analysis • Inferential statistics • Predictive analytics • Prescriptive analytics B. How we data mined across multiple types of health care data We integrated disparate data from across the health care system into a single source of truth which allowed us to answer the providers’ questions. We accomplished this by a systematic approach: • Create date linkages between silos • Demonstrate opportunities for actionable interventions C. Exploring the data with visualizations Taproot visualizations presented different graphical and numerical interpretations of the coalesced care episode con- struct data. End-users utilized a variety of filters ranging from initiating of facility type to number of short-term acute care hospital readmissions in the risk bearing period to specific anchor care episodes to interact with these data. These strategic filters allowed clinical, financial, and operational representatives within the designated market to ask questions of the data based on their particular discipline and relevancy to the demonstration project, but without losing context of the provider organization as a whole. These web-based visu- alizations provided a readily available secure collaboration space for the different representatives to determine how best to adjust care delivery practices and the clinical strategy necessary to facilitate the demonstration project. C. How data mining allowed a design for health care decision support We developed a sophisticated health IT solution that requires computable biomedical knowledge, patient specific
Fig. 3. Investigate sites of care before 1st readmission. Fig. 2. Review contributing factors of a readmission. F. How we integrated data mining tools into the health care delivery work-flow data, and a reasoning or inferencing mechanism which com- bines knowledge and data to generate and present helpful information to clinicians and operators as care is being de- livered. This information is organized, filtered, and presented in such a way that supports current work-flows and allows field practitioners to take actions quickly, providing three main results: • Identifying areas to increase quality of care leading to enhanced health outcomes • Detecting patterns of care that may lead to adverse events: a short-term acute care hospital readmission within the risk bearing period • Improving efficiency, cost-benefit, and provider and patient satisfaction The solution provided the opportunity for post-acute care provider representatives in different geographic regions of the country to collaborate on the demonstration project from a centralized portal experience. This allowed the following multi-disciplinary collaboration opportunities: • Monitoring STACH readmissions by anchor care episode • Comparing the financial performance, total spend-to- target price, by anchor episode and by site of care over different time periods • Improving care transition management into the demon- stration project, the bundle, by providing the care intake specialist condition-specific information to enhance care coordination with originating participant STACH facil- ities D. How data mining assisted with condition management and surveillance We systematically collected, analyzed, interpreted, and disseminated patient outcome data for care action to reduce morbidity and mortality using syndrome surveillance of se- lected anchor conditions. We built surveillance for congestive heart failure (CHF), chronic obstructive pulmonary disease (COPD), Hip & Femur, Major Joint, Other Respiratory, Pneumonia, and Sepsis. IV. CONCLUSIONS The recent publication surrounding Comprehensive Care for Joint Replacement (CCJR) addressed the need for pay- ment standardization for bundled payments suggests the journey to value-based care continues [1]. Value-based reim- bursement arrangements buttress quality initiatives impacting patient engagement, care coordination, and population health management. Post-acute care provides an invaluable part of the care continuum. Integrated delivery networks and health systems position post-acute care facilities higher in their merger and acquisition strategy as a means to position patient referrals for future encounters as reimbursement practices migrate from fee-for-service to value-based arrangements. In the con- tinued journey to value-based care, health care organizations rely on data mining and visualizations to explore, implement, and operationalize value-based payment arrangements. E. Tailoring clinical care with data mining Our solution recognizes each patient as an individual with unique health care needs and provides support for enhancing the range of services delivered during the risk bearing period after a STACH discharge. We emphasize data exploration and analysis to help refine and promote clinical strategies to enhance preventive care and improve transitional care de- livery work-flow. Using our solution, clinical directors were able to work with physicians, health advocates, transitional care managers, clinical staff, and mental health partners to maintain good health and manage the selected conditions.
With this need in mind, the operationalized visualizations that we created through our study allowed for the improve- ment in the way care is delivered to patients across the care continuum. By offering discovery and accountability across a health care organization, post-acute care operators, clinicians, and financiers easily discovered actionable insights from the developed visualizations and were provided decision support for high-quality, effective, and less costly care. We were able to accomplish the enhancements to the care delivery process through improved care-transitions, coordination of care, and collaboration of best practices. As independent or group post-acute care organizations evolve, the ability to analyze and ask a multitude of varying questions of these organizations’ data will remain at the forefront in the journey from fee-for-service to value-based care. Furthering analytic endeavors through data discovery and visualization help post-acute care providers meet the challenges in the dynamic landscape of patient engagement, the pursuit of quality, and the changing reimbursement arrangements. ACKNOWLEDGMENT The research for this paper was financially supported by WPC Healthcare. In developing the ideas presented herein, we would like to thank the post-acute provider and its representatives for their helpful input. REFERENCES [1] Slavitt, A., & Burwell, S. (2015, July 1). Medicare Program; Compre- hensive Care for Joint Replacement Payment Model for Acute Care Hospitals Furnishing Lower Extremity Joint Replacement Services. Retrieved August 19, 2015. [2] W.-K. Chen, Linear Networks and Systems (Book style). Belmont, CA: Wadsworth, 1993, pp. 123135. [3] H. Poor, An Introduction to Signal Detection and Estimation. New York: Springer-Verlag, 1985, ch. 4. [4] Tufte, E. R. (1991). Envisioning information. Optometry & Vision Science, 68(4), 322-324. [5] Heer, J., & Agrawala, M. (2008). Design considerations for collabo- rative visual analytics. Information visualization, 7(1), 49-62. [6] Sood, N., Huckfeldt, P. J., Escarce, J. J., Grabowski, D. C., & Newhouse, J. P. (2011). Medicares bundled payment pilot for acute and postacute care: analysis and recommendations on where to begin. Health Affairs, 30(9), 1708-1717. [7] Struijs, J. N., & Baan, C. A. (2011). Integrating care through bundled paymentslessons from the Netherlands. New England Journal of Medicine, 364(11), 990-991. [8] Share, D. A., Campbell, D. A., Birkmeyer, N., Prager, R. L., Gurm, H. S., Moscucci, M., ... & Birkmeyer, J. D. (2011). How a regional collaborative of hospitals and physicians in Michigan cut costs and improved the quality of care. Health Affairs, 30(4), 636-645. [9] Boult, C., Green, A. F., Boult, L. B., Pacala, J. T., Snyder, C., & Leff, B. (2009). Successful models of comprehensive care for older adults with chronic conditions: evidence for the Institute of Medicine’s retooling for an aging America report. Journal of the American Geriatrics Society, 57(12), 2328-2337. [10] Wilson, N. A., Schneller, E. S., Montgomery, K., & Bozic, K. J. (2008). Hip and knee implants: current trends and policy consider- ations. Health Affairs, 27(6), 1587-1598.