Download
1 / 26
260 likes | 286 Vues
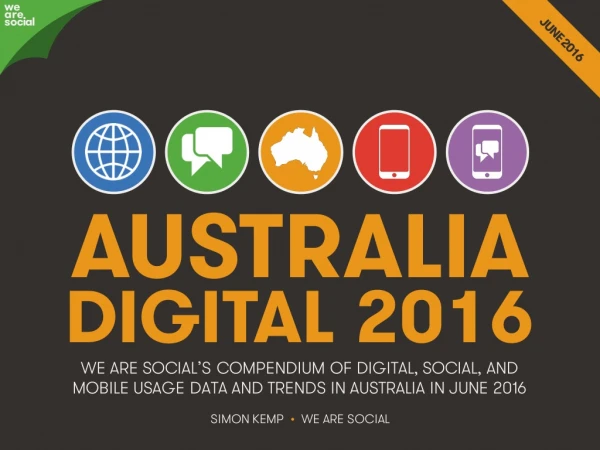
Everything you need to know about mobile, internet, social media, and e-commerce use in Australia in June 2016. For more reports, including the latest global trends and individual data for more than 230 countries around the world, visit http://datareportal.com

E N D
we are social AUSTRALIA DIGITAL 2016 WE ARE SOCIAL’S COMPENDIUM OF DIGITAL, SOCIAL, AND MOBILE USAGE DATA AND TRENDS IN AUSTRALIA IN JUNE 2016 SIMON KEMP • WE ARE SOCIAL @wearesocialau • 1
GLOBAL STATSHOT @wearesocialau • 4
JUN 2016 GLOBAL DIGITAL STATSHOT A SNAPSHOT OF THE WORLD’S KEY DIGITAL STATISTICAL INDICATORS TOTAL INTERNET USERS ACTIVE SOCIAL MEDIA USERS UNIQUE MOBILE USERS ACTIVE MOBILE SOCIAL USERS POPULATION 7.43 3.42 2.56 4.76 2.26 BILLION BILLION BILLION BILLION BILLION URBANISATION: 54% PENETRATION: 46% PENETRATION: 34% PENETRATION: 64% PENETRATION: 30% FIGURE REPRESENTS TOTAL GLOBAL POPULATION, INCLUDING CHILDREN FIGURE INCLUDES ACCESS VIA FIXED AND MOBILE CONNECTIONS FIGURE BASED ON ACTIVE USER ACCOUNTS, NOT UNIQUE INDIVIDUALS FIGURE REPRESENTS UNIQUE MOBILE PHONE USERS FIGURE BASED ON ACTIVE USER ACCOUNTS, NOT UNIQUE INDIVIDUALS • Sources: Population: UN, US Census Bureau; Internet: ITU, InternetWorldStats, CIA, national government ministries and industry associations; • Social & Mobile Social: Facebook, Tencent, VKontakte, LiveInternet.ru, Nikkei, VentureBeat, Niki Aghaei; Mobile: GSMA Intelligence. @wearesocialau • 5
JUN 2016 WORLD’S TOP SOCIAL PLATFORMS MOST RECENTLY PUBLISHED NUMBER OF MONTHLY ACTIVE USER ACCOUNTS BY PLATFORM, IN MILLIONS 1,650 FACEBOOK 1,000 WHATSAPP 900 877 FB MESSENGER QQ 762 WECHAT 648 QZONE 555 TUMBLR 400 INSTAGRAM 310 300 300 TWITTER SKYPE BAIDU TIEBA 249 VIBER 222 215 200 SINA WEIBO LINE SNAPCHAT 122 106 100 100 100 100 YY LINKEDIN SOCIAL NETWORK VKONTAKTE PINTEREST MESSENGER / CHAT APP / VOIP BBM TELEGRAM @wearesocialau • 6 • Sources: latest company statements as published in press releases and quarterly results, correct as at 03 June 2016
AUSTRALIA @wearesocialau • 7
JUN 2016 DIGITAL IN AUSTRALIA A SNAPSHOT OF THE COUNTRY’S KEY DIGITAL STATISTICAL INDICATORS TOTAL INTERNET USERS ACTIVE SOCIAL MEDIA USERS MOBILE ACTIVE MOBILE SOCIAL USERS POPULATION CONNECTIONS 24.1 21.2 15.0 30.6 13.0 MILLION MILLION MILLION MILLION MILLION URBANISATION: 90% PENETRATION: 88% PENETRATION: 62% vs POPULATION: 127% PENETRATION: 54% FIGURE REPRESENTS TOTAL NATIONAL POPULATION, INCLUDING CHILDREN FIGURE INCLUDES ACCESS VIA FIXED AND MOBILE CONNECTIONS FIGURE BASED ON ACTIVE USER ACCOUNTS, NOT UNIQUE INDIVIDUALS FIGURE REPRESENTS MOBILE SUBSCRIPTIONS, NOT UNIQUE USERS FIGURE BASED ON ACTIVE USER ACCOUNTS, NOT UNIQUE INDIVIDUALS @wearesocialau • 8 • Sources: Australia Bureau of Statistics (May 2016); Internet World Stats (Nov 2015); Facebook (May 2016); GSMAIntelligence (Jan 2016)
JAN 2016 ANNUAL GROWTH GROWTH TRENDS FOR THE COUNTRY’S KEY DIGITAL STATISTICAL INDICATORS GROWTH IN THE NUMBER OF ACTIVE INTERNET USERS GROWTH IN THE NUMBER OF ACTIVE SOCIAL MEDIA USERS GROWTH IN THE NUMBER OF MOBILE SUBSCRIPTIONS GROWTH IN THE NUMBER OF ACTIVE MOBILE SOCIAL USERS +2% +3% +2% +8% SINCE JAN 2015 SINCE JAN 2015 SINCE JAN 2015 SINCE JAN 2015 @wearesocialau • 9 • Sources: UN, US Census Bureau; InternetWorldStats, Facebook, GSMA Intelligence.
JUN 2016 DIGITAL DEVICE OWNERSHIP PERCENTAGE OF THE ADULT POPULATION*THAT OWNS EACH KIND OF DEVICE MOBILE PHONE (ALL TYPES) SMART PHONE LAPTOP OR DESKTOP COMPUTER TABLET DEVICE 91% 77% 80% 41% TV STREAMING DEVICE HANDHELD GAMING CONSOLE E-READER DEVICE WEARABLE TECH DEVICE 20% 7% 4% [N/A] @wearesocialau • 10 • Source: Google Consumer Barometer 2015. Figures based on responses to a questionnaire. *Please see notes at the end of the report for definitions.
JAN 2016 TIME SPENT WITH MEDIA SURVEY-BASED DATA: FIGURES REPRESENT USERS’ OWN CLAIMED / REPORTED ACTIVITY AVERAGE DAILY USE OF THE INTERNET VIA A PC OR TABLET AVERAGE DAILY USE OF THE INTERNET VIA A MOBILE PHONE AVERAGE DAILY USE OF SOCIAL MEDIA VIA ANY DEVICE AVERAGE DAILY TELEVISION VIEWING TIME 3H 38M 1H 06M 1H 09M 2H 36M @wearesocialau • 11 • Source: GlobalWebIndex, Q4 2015. Based on a survey of internet users aged 16-64. Averages also factor non-users.
JAN 2016 INTERNET USE BASED ON REPORTED ACTIVE INTERNET USER DATA, AND USER-CLAIMED MOBILE INTERNET USE TOTAL NUMBER OF ACTIVE INTERNET USERS INTERNET USERS AS A PERCENTAGE OF THE TOTAL POPULATION TOTAL NUMBER OF ACTIVE MOBILE INTERNET USERS MOBILE INTERNET USERS AS A PERCENTAGE OF THE TOTAL POPULATION # # 21.2M 88% 12.9M 54% @wearesocialau • 12 • Sources: InternetWorldStats; mobile internet data based on GlobalWebIndex Q4 2015 survey; data has been rebased to show national penetration.
JUN 2016 INTERNET USERS: PERSPECTIVE ESTIMATES OF THE TOTAL NUMBER OF INTERNET USERS FROM DIFFERENT DATA PROVIDERS INTERNET USERS: INTERNETWORLDSTATS DATA INTERNET USERS: ITU DATA INTERNET USERS: CIA DATA # # # 21.18M 20.41M 20.20M @wearesocialau • 13 • Sources: InternetWorldStats, ITU, CIA.
JAN 2016 FREQUENCY OF INTERNET USE HOW OFTEN INTERNET USERS ACCESS THE INTERNET FOR PERSONAL REASONS (ANY DEVICE) USE THE INTERNET EVERY DAY USE THE INTERNET AT LEAST ONCE PER WEEK USE THE INTERNET AT LEAST ONCE PER MONTH USE THE INTERNET LESS THAN ONCE PER MONTH 1 7 31 ? 87% 11% 2% <1% @wearesocialau • 14 • Source: Google Consumer Barometer 2015. Figures based on responses to a questionnaire. Totals may exceed 100% due to rounding.
JUN 2016 SHARE OF WEB TRAFFIC BASED ON EACH DEVICE’S SHARE OF THE TOTAL WEB PAGES SERVED TO WEB BROWSERS SHARE OF WEB PAGE VIEWS: LAPTOPS & DESKTOPS SHARE OF WEB PAGE VIEWS: MOBILE PHONES SHARE OF WEB PAGE VIEWS: TABLETS SHARE OF WEB PAGE VIEWS: OTHER DEVICES 59% 28% 12% 0.1% YEAR-ON-YEAR: -7% YEAR-ON-YEAR: +17% YEAR-ON-YEAR: -1% YEAR-ON-YEAR: +75% @wearesocialau • 15 • Source: StatCounter, Q2 2016.
JUN 2016 SOCIAL MEDIA USE BASED ON MONTHLY ACTIVE USER NUMBERS REPORTED BY THE COUNTRY’S MOST ACTIVE PLATFORM TOTAL NUMBER OF ACTIVE SOCIAL MEDIA USERS ACTIVE SOCIAL USERS AS A PERCENTAGE OF THE TOTAL POPULATION TOTAL NUMBER OF SOCIAL USERS ACCESSING VIA MOBILE ACTIVE MOBILE SOCIAL USERS AS A PERCENTAGE OF THE TOTAL POPULATION # # 15.0M 62% 13.0M 54% @wearesocialau • 16 • Sources: Facebook Q2 2016
JUN 2016 PENETRATION BY PLATFORM SURVEY-BASED DATA: FIGURES REPRESENT USERS’ OWN CLAIMED / REPORTED ACTIVITY 71% FACEBOOK 43% FB MESSENGER 31% GOOGLE+ 31% LINKEDIN 30% TWITTER 22% INSTAGRAM 22% WHATSAPP 21% PINTEREST 15% SNAPCHAT SOCIAL NETWORK MESSENGER / CHAT APP / VOIP 14% VIBER @wearesocialau • 17 • Source: GlobalWebIndex, Q1 2016. Based on a survey of internet users aged 16-64. Note: Data has been re-based to show national penetration.
APR 2016 USERS BY SOCIAL PLATFORM NUMBER OF MONTHLY ACTIVE USERS ON EACH PLATFORM, BASED ON DATA FROM VARIOUS SOURCES 15.0 M FACEBOOK 5.0 M INSTAGRAM 4.4 M TUMBLR 3.9 M LINKEDIN 2.8 M TWITTER 2.4 M WHATSAPP 2.0 M SNAPCHAT 300 K PINTEREST 80 K MYSPACE SOCIAL NETWORK MESSENGER / CHAT APP / VOIP 60 K GOOGLE+ @wearesocialau • 18 • Source: SocialMediaNews.com.au (April 2016)
JUN 2016 FACEBOOK USER PROFILE DETAIL OF FACEBOOK USERS BY AGE GROUP AND GENDER, IN MILLIONS SHARE OF TOTAL FACEBOOK USERS AGE TOTAL FEMALE MALE 2.0 2.0 FEMALE TOTAL 15,000,000 53% 47% MALE 13 – 19 11% 6% 6% 20 – 29 28% 14% 14% 1.6 30 – 39 21% 11% 10% 1.5 40 – 49 17% 9% 8% 50 – 59 12% 7% 5% 1.3 60+ 11% 6% 5% 1.1 1.0 0.9 0.8 0.8 0.7 0.7 13 – 19 YEARS OLD 20 – 29 YEARS OLD 30 – 39 YEARS OLD 40 – 49 YEARS OLD 50 – 59 YEARS OLD 60+ YEARS OLD @wearesocialau • 19 • Source: We Are Social’s analysis of Facebook-reported data, Q2 2016. Note: table values may not sum to 100% due to rounding in reported data.
JAN 2016 MOBILE USERS & CONNECTIONS COMPARING THE NUMBER OF UNIQUE MOBILE USERS TO THE NUMBER OF MOBILE CONNECTIONS NUMBER OF UNIQUE MOBILE USERS (ANY TYPE OF HANDSET) MOBILE PENETRATION (UNIQUE USERS vs. POPULATION) NUMBER OF MOBILE CONNECTIONS (SUBSCRIPTIONS) MOBILE CONNECTIONS AS A PERCENTAGE OF TOTAL POPULATION AVERAGE NUMBER OF CONNECTIONS PER UNIQUE MOBILE USER # # 19.1M 79% 30.6M 127% 1.60 @wearesocialau • 20 • Sources: extrapolated from eMarketer data; GSMA Intelligence, Q4 2015. UN, US Census Bureau for population data.
JAN 2016 MOBILE CONNECTIONS BASED ON THE NUMBER OF CELLULAR SUBSCRIPTIONS / CONNECTIONS (NOT UNIQUE USERS) TOTAL NUMBER OF MOBILE SUBSCRIPTIONS MOBILE SUBSCRIPTIONS AS A PERCENTAGE OF THE TOTAL POPULATION PERCENTAGE OF MOBILE CONNECTIONS THAT ARE PRE-PAID PERCENTAGE OF MOBILE CONNECTIONS THAT ARE POST-PAID PERCENTAGE OF MOBILE CONNECTIONS THAT ARE BROADBAND (3G & 4G) # 30.6M 127% 33% 67% 94% @wearesocialau • 21 • Sources: GSMA Intelligence, Q4 2015; UN, US Census Bureau for population data.
JAN 2016 MOBILE ACTIVITIES SURVEY-BASED DATA: FIGURES REPRESENT USERS’ OWN CLAIMED / REPORTED ACTIVITY PERCENTAGE OF THE POPULATION USING MOBILE MESSENGERS PERCENTAGE OF THE POPULATION WATCHING VIDEOS ON MOBILE PERCENTAGE OF THE POPULATION PLAYING GAMES ON MOBILE PERCENTAGE OF THE POPULATION USING MOBILE BANKING PERCENTAGE OF THE POPULATION USING MOBILE MAP SERVICES $ 34% 25% 20% 32% 34% @wearesocialau • 22 • Source: GlobalWebIndex, Q4 2015. Based on a survey of internet users aged 16-64. Note: Data has been re-based to show national penetration.
JAN 2016 E-COMMERCE BY DEVICE SURVEY-BASED DATA: FIGURES REPRESENT USERS’ OWN CLAIMED / REPORTED ACTIVITY PURCHASED A PRODUCT OR SERVICE ONLINE IN THE PAST 30 DAYS SEARCHED ONLINE FOR A PRODUCT OR SERVICE TO BUY IN THE PAST 30 DAYS VISITED AN ONLINE RETAIL STORE IN THE PAST 30 DAYS MADE AN ONLINE PURCHASE VIA A LAPTOP OR DESKTOP COMPUTER IN THE PAST 30 DAYS MADE AN ONLINE PURCHASE VIA A MOBILE DEVICE IN THE PAST 30 DAYS 62% 70% 51% 57% 19% @wearesocialau • 23 • Source: GlobalWebIndex, Q4 2015. Based on a survey of internet users aged 16-64. Note: Data has been re-based to show national penetration.
WE ARE A GLOBAL AGENCY . WE DELIVER WORLD-CLASS CREATIVE IDEAS WITH FORWARD-THINKING BRANDS. WE BELIEVE IN PEOPLE, NOT PLATFORMS, AND THE POWER OF SOCIAL INSIGHT TO DRIVE BUSINESS VALUE. WE CALL THIS SOCIAL THINKING. WE’RE ALREADY HELPING MANY OF THE WORLD’S TOP BRANDS, INCLUDING ADIDAS, UNILEVER, DIAGEO, NESTLÉ, HEINZ, AND LVMH. FIND OUT MORE AT WEARESOCIAL.COM. @wearesocialau • 24
DISCLAIMER AND IMPORTANT NOTES This report has been compiled by We Are Social Ltd (“We Are Social”) for informational purposes only, and relies on data from a wide variety of sources, including but not limited to public and private companies, market research firms, government agencies, NGOs, and private individuals. While We Are Social strives to ensure that all data and charts contained in this report are, as at the time of publishing, accurate and up-to-date, We Are Social shall not be responsible for any errors or omissions contained in this report, or for the results obtained from its use. flags, analyses and technical notes that relate to various geographical territories around the world, however reference to these territories and any associated elements (including names and flags) does not imply the expression of any opinion whatsoever on the part of We Are Social, or any of the featured brands, nor any of those organisations’ partners, employees or agents, concerning the legal status of any country, territory, city or area or of its authorities, or concerning the delimitation of its frontiers or boundaries. employees or agents shall, to the fullest extent permitted by law, be liable to you or anyone else for any direct, indirect, punitive, incidental, special, consequential, exemplary or similar loss or damage, or loss or damage of any kind, suffered by you or anyone else as a result of any use, action or decision taken by you or anyone else in any way connected to this report or the information contained herein, or the result(s) thereof, even if advised of the possibility of such loss or damage. affiliates, This report may contain references to third parties, however this report does not endorse any such third parties or their products or services, nor is this report sponsored, endorsed or associated with such third parties. All information contained in this report is provided “as is”, with no guarantee whatsoever of its accuracy, completeness, correctness or non- infringement of third-party rights and without warranty of any kind, express or implied, including without limitation, warranties of merchantability or fitness for any particular purpose. This report contains data, tables, figures, maps, This report is provided with the understanding that it does not constitute professional advice of any kind and should therefore not be substituted for independent investigations, thought or judgment. Accordingly, neither We Are Social nor any of the brands or organisations featured or cited herein, nor any of their partners, affiliates, group companies, or services This report is subject to change without notice. To ensure you have the most up- to-date version of this report, please visit http://datareportal.com/