DMI Modeling Systems And Plans For CEEH Activities
250 likes | 551 Vues
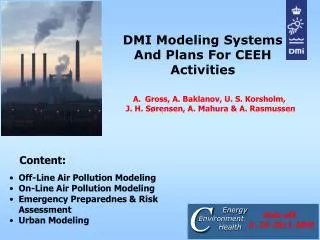
C. Energy Environment Health. DMI Modeling Systems And Plans For CEEH Activities. Gross, A. Baklanov, U. S. Korsholm, J. H. Sørensen, A. Mahura & A. Rasmussen. Content:. Off-Line Air Pollution Modeling On-Line Air Pollution Modeling

DMI Modeling Systems And Plans For CEEH Activities
E N D
Presentation Transcript
C Energy Environment Health DMI Modeling Systems And Plans For CEEH Activities • Gross, A. Baklanov, U. S. Korsholm, • J. H. Sørensen, A. Mahura & A. Rasmussen Content: • Off-Line Air Pollution Modeling • On-Line Air Pollution Modeling • Emergency Preparednes & Risk • Assessment • Urban Modeling Kick-off. d. 23-25/1 2007
C Energy Environment Health Chemical Solvers Aerosol Module UTLS Trans. Models Air Pollution Modeling At DMI • PSC aerosols • Tropospheric • aerosols • Approaches: • Normal distribution, • Bin approach • Physics: • Condensation • Evaporation • Emission • Nucleation • Deposition • Gas Phase • Aqueous phase • Chemical equil. • Climate Modeling • Approaches: • RACM, CBIV, • ISORROPIA Lagrangian transport, 3-D regional scale Eulerian trans- port 0..15 lat-lon grid, 3-D regional scale ECMWF DMI-HIRLAM Met. Models Eulerian trans- port 0.2-0.05 lat-lon, 25-40 vert. layer, 3-D regional scale Stochastic Lagrangian transport, 3-D regional scale Tropo. Trans. Models City-Scale Obstacle Resolved Modelling TSU-CORM Emergency Pre- parednes & Risk Assess- ment. DERMA Off-Line Chemical Aerosol Trans. CAC On-Line Chemical Aerosol Trans. ENVIRO-HIRLAM Regional (European) scale air pollution: smog and ozone, pollen. Nuclear, veterinary and chemical. Regional (European) to city scale air pollution: smog and ozone.
C Energy Environment Health • Currently nested versions of HIRLAM: • T – 15x15 km2, 40 vertical layers. • S – 5x5 km2, 40 vertical layers. • Q – 5x5 km2, 40 vertical layers. • Test version of 1.5x1.5 km2 of DK. DMI-HIRLAM Q A forecast integration starts out by assimilation of meteorological observations whereby a 3-d state of the atmosphere is produced, which as well as possible is in accordance with the observations. S T A numerical weather prediction system consists of pre-processing, climate file generation, data-assimilation and analysis, initialization, forecast, post-processing and verification.
C Energy Environment Health Modeling Area Simulation period: Year 2000 to 2100 Climate Change Scanarios Modeling By HIRHAM • Horizontal resolution 25x25 km2. • Vertical resolution 19 levels. Output of meteorological parameter: From 3-6 hours to once a day depend on the parameter.
C Energy Environment Health Off-Line modelling with CAC T:0.15º×0.15º Simulation domain Horizontal resolution 0.2º×0.2º. S: 0.05º×0.05º CAC Model Area
C Energy Environment Health ENSEMBLE JRC project exp. nr. 11 (Off-Line)
Ozone C Energy Environment Health 36 hour forecast 48 hour forecast ppbV 0 15 30 60 90 120 150 “Semi”-operational forecasts 4 times a day of O3, NO, NO2, CO, SO2, Rn, Pb, “PM2.5”, “PM10”. (Off-Line)
On-line coupling Only one grid; No interpolation in space No time interpolation Physical parameterizations are the same; No inconsistencies Possibility of feedbacks bewte-en air pollution and meteoro-logy All 3D met. variables are ava-ilable at the right time (each time step); No restriction in variability of met. fields Does not need meteo- pre/postpro-cessors Off-line Possibility of independent parame-terizations Low computational cost; More suitable for ensembles and oprational activities Independence of atmospheric pol-lution model runs on meteorolo-gical model computations More flexible grid construction and generation for ACT models C Energy Environment Health Advantages of On-line & Off-line modeling
C Energy Environment Health Examples of feedbacks
C Energy Environment Health On-Line Modeling With ENVIRO-HIRLAM U, V, W, T, q, U*, L Emission Transport Dispersion Clouds Precipitation Radiation DMI-HIRLAM Gas phase chemistry Aerosol chemistry Aerosol physics Deposition Concentration/Mixing ratio
C Energy Environment Health Chernobyl Simulation 0.15°x0.15°, d. 7/5-1986, 18.00 UTC Dry deposition (kBq/m2) Total deposition statistics: Corr = 0.59, NMSE 6.3
Difference (ref – perturbation) in Accumulated dry deposition [ng/m2] Accumulated (reference) dry deposition [μg/m2] +48 h
C Energy Environment Health Emergency Preparednes & Risk Assessment Using the 3-D Stochastic Lagragian Regional Scale Model DERMA Examples: • Probabilistic Risk Assessment. • Source Determination by Inverse Modelling. • Chemical Emergency Preparednes. • Urban Meteorology Effects.
C Energy Environment Health Probabilistic Risk Assessment Risk atlas of potential threats from long-range atmospheric dispersion and deposition of radionuclides. Sellafield nuclear fuel reprocessing plant Yearly deposition Yearly time-integrated concentration
C Energy Environment Health Source Determination by Inverse Modelling Hypothetical release of 100 g Anthrax spores Determination of source location by adjoint DERMA using monitoring data. No a priori assumption about source (point, area, …). Inhalation dose calculated by DERMA based on DMI-HIRLAM. Monitoring stations
C Energy Environment Health Aalborg Portland, 23 October 2005 Accidental fire in waste deposit Accidental fire in waste deposit.
C Energy Environment Health Aalborg Portland, 23 October 2005 Accidental fire in waste depositDERMA calculations
Wake diffu-sion Radiation Drag C Energy Environment Health Wall Roof Momentum Turbu-lence Heat Street Urban Features
C Energy Environment Health Urban Effects The ABL height calculated from different DMI-HIRLAM data (left: urbanized, right: operational T). Main cities and their effect on the ABL height are shown by arrows.
C Energy Environment Health Urban Effects Local-scale RIMPUFF plume corresponding to a hypothetical release calculated by using DMI-HIRLAM data. Cs-137 air concentration for different DMI-HIRLAM versions(left: urbanized 1.4-km resolution, mid: operational 5 km, right: operational 15 km).
C Energy Environment Health Streamlines and air pollution conc City-Scale Obstacle-Resolved Modeling (TSU-CORM) 3 d. fluid dynamic air pollution model Resolution: Horizontal: 1x1 m2 Vertical: from 1m Will be implemented spring 2007 at DMI and linked with DMI-HIRLAM, CAC and /or ENVIRO-HIRLAM.
C Energy Environment Health DMIs Possible Modeling Activities In CEEH Modeling of the environmental impact of energy production/consumption • Long-term simulations: • ENVIRO-HIRLAM and/or CAC. • Episodes: • ENVIRO-HIRLAM. Climate change impact on air pollution and population health • Long-term simulation of ENVIRO- HIRLAM and/or CAC using HIRHAM Meteorology. Kick-off. d. 23-25/1 2007
C Energy Environment Health DMIs Possible Modeling Activities In CEEH Optimization modeling of environmental risk/impact studies • Modify DERMA or CAC for sensitivi- ty, risk/impact minimization and optimization studies. • Sensitivity studies for environmen- tal risk/impact assessments. Human exposure modeling • City scale modeling using TSU- CORM. • Link the air pollution prediction from ENVIRO-HIRLAM or CAC to population activity (human expo- sure modeling). Kick-off. d. 23-25/1 2007
C Energy Environment Health FUMAPEX integrated population health impact study © Helsingin kaupunki, Kaupunginmittausosasto 576§/1997, ©Aineistot: Espoon, Helsingin, Kauniaisten ja Vantaan mittausosastot The predicted exposure of population to NO2 (g/m3 *persons). Environmental Office