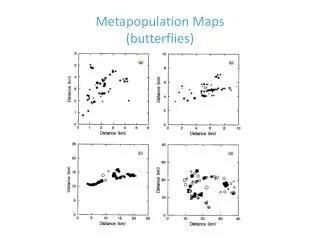
Metapopulation and Intertrophic Dynamics
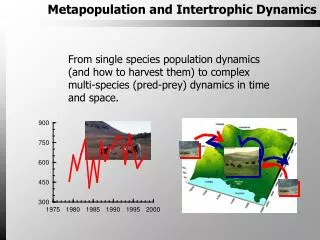
Metapopulation and Intertrophic Dynamics. From single species population dynamics (and how to harvest them) to complex multi-species (pred-prey) dynamics in time and space . Metapopulation and Intertrophic Dynamics. abiotic factors? ( density independence ). Herons, UK. stability.

Metapopulation and Intertrophic Dynamics
E N D
Presentation Transcript
Metapopulation and Intertrophic Dynamics From single species population dynamics (and how to harvest them) to complex multi-species (pred-prey) dynamics in time and space.
Metapopulation and Intertrophic Dynamics abiotic factors? (density independence) Herons, UK stability fluctuations biotic factors? (density dependence) BHT: fig. 10.17
Metapopulation and Intertrophic Dynamics A+B+C A Density C B SdrJylland DK Population-level analysis! Then again … where is the population-level?
Metapopulation and Intertrophic Dynamics Dispersal – an important population process Searocket (Cakile edentula) BHT: fig. 15.19
Metapopulation and Intertrophic Dynamics (1) Metapopulations: living in a patchy environment (2) Intertrophic dynamics: squeezed from above and below
Metapopulation Dynamics Do animals occupy all suitable habitats within their geographic range? 39 sites water vole Slope, vegetation, heterogeneity human disturbance 10 core, 15 peripheral & 14 no-visit Lawton & Woodroffe 1991
Metapopulation Dynamics core sites Increase in % grass no-visit sites reduced colonization rates Increasing bank angle and structural heterogeneity predation Do animals occupy all suitable habitats within their geographic range? PCA performed water vole 55% with suitable habitats ... ...30% lack voles because... Know your species...! Lawton & Woodroffe 1991
Metapopulation Dynamics ...and know your landscape! Hanski & Gilpin 1997
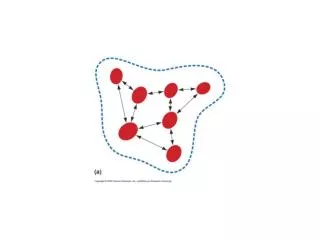
Metapopulation Dynamics Equilibrium “population” of species (extinction - recolonization) Metapopulation theory The MacArthur-Wilson Equilibrium theory
Metapopulation Dynamics Metapopulation Metapopulation theory Mainland-Island model (Single-species version of the M-W multi-species model)
Metapopulation Dynamics Metapopulation Metapopulation theory Mainland-Island model (Single-species version of the M-W multi-species model) Levins’s metapopulation model (no mainland; equally large habitat patches)
Metapopulation Dynamics P : fraction of patches occupied (1-P) : fraction not occupied Metapopulation theory Levins’s model (equal patch size) m : recolonization rate e : extinction rate recolonization – increases with BOTH the no of empty patches (1-P) AND with the no of occupied patches (P). extinction – increases with the no of patches prone to extinction (P).
Metapopulation Dynamics Metapopulation theory Levins’s model P : fraction of patches occupied (1-P) : not occupied m : recolonization rate e : extinction rate
Metapopulation Dynamics P 1-e/m time Metapopulation theory Levins’s model P : fraction of patches occupied (1-P) : not occupied m : recolonization rate e : extinction rate Given that (m – e)> 0, the metapop will grow until equlibrium: (trivial: P* = 0) dP/dt = 0 => P* = 1 – e/m
Metapopulation Dynamics Melitaea cinxia local patches the metapop persists: ln(1991) = ln(1993) Hanski et al. 1995 Metapopulation theory NOTE: the metapop persists, stably, as a result of the balance between m and edespite unstable local populations!
Metapopulation Dynamics Levins M-I Metapopulation theory Mainland-Island model Levins’s metapopulation model
Metapopulation Dynamics Metapopulation theory Mainland-Island model Variable patch size Levins’s metapopulation model
Metapopulation Dynamics Metapopulation theory Mainland-Island model a = 0 Variable patch size model a = Levins’s metapopulation model Increasinga, the freq of larger patches decreases
Metapopulation Dynamics Melitaea cinxia dP/dt = 0 => P1* = 1 – e/m P2* = 0 Hanski et al. 1995 Metapopulation theory Levins’s model: Value ofa! Hanski & Gyllenberg (1993) Two general metapopulation models and the core-satellite species hypothesis. American Naturalist142, 17-41 across metapops
Intertrophic Dynamics (i) Predation on prey are biased Thomson’s Gazelle BHT: fig. 8.9 (2) Intertrophic dynamics: squeezed from above and below
Intertrophic Dynamics mates territories There is density dependence (crowding), which may influence or be influenced buy predation! (2) Intertrophic dynamics: squeezed from above and below (ii) Predators AND prey are also ”squeezed from the side”
Intertrophic Dynamics Hokkaido Long winter DD intense Short winter DD weak Demonstrating the effect of predation is NOT straight forward multiannual cyclic seasonal fluctuations
Intertrophic Dynamics Italian mat-phys The Lotka - Volterra model % pred fish Vito Volterra (1860-1940) American mat-biol Alfred J Lotka (1880-1949)
Intertrophic Dynamics q: mortality The Lotka-Volterra model Predator (P) a': hunting eff. per predator - qP fa’PN f: ability to convert food to offspring - a’PN + fa’PN r: intrinsic rate of increase rN - a’PN Prey(N)
Intertrophic Dynamics - qP* fa’P*N* = 0 = 0 rN* - a’P*N* predator mortality offpring/prey = qP* fa’P*N* hunting effeciency rN* = a’P*N* prey reproduction The Lotka-Volterra model isoclines,dN/dt = dP/dt = 0 (Predator isocline) (Prey isocline) => N* = q/fa’ => P* = r/a’
Intertrophic Dynamics P P* predator mortality N* N offpring/prey P P* hunting effeciency prey reproduction N* N The Lotka-Volterra model isoclines,dN/dt = dP/dt = 0 N* = q/fa’ P* = r/a’
Intertrophic Dynamics BHT: fig. 10.2 P* N* The Lotka-Volterra model P N* = q/fa’ Predator isocline: P* = r/a’ Prey isocline: N
Intertrophic Dynamics P Crowding in predators: Hunting effeciency (a’ ) decreases with increasing P P* N* N N* = q/fa’ Predator isocline: P* = r/a’ Prey isocline: Crowding in the Lotka-Volterra model
Intertrophic Dynamics Crowding in prey: Reproduction rate (r ) decreases with increasing N N* = q/fa’ Predator isocline: P* = r/a’ Prey isocline: Crowding in the Lotka-Volterra model P Crowding in predators: Hunting effeciency (a’ ) decreases with increasing P P* N* N
Intertrophic Dynamics Crowding in prey: Reproduction rate (r ) decreases with increasing N N* = q/fa’ Predator isocline: P* = r/a’ Prey isocline: Crowding in the Lotka-Volterra model P Crowding in predators: Hunting effeciency (a’ ) decreases with increasing P P* KN N* N
Intertrophic Dynamics Combining DD in predator and prey Predator isocline Prey isocline Less effecient predator Predator isocline Prey isocline Strong DD in predator Prey isocline N* = q/fa’ Predator isocline: Predator isocline P* = r/a’ Prey isocline: Crowding in the Lotka-Volterra model BHT: fig. 10.7 The greater the distance from Eq, the quicker the return to Eq!
Intertrophic Dynamics Functional response and prey-switching Switch of prey P eat another prey eat this prey N(this prey) P KN N (this prey)
Intertrophic Dynamics Switch of prey At low N there’s no effect of predator P N (this prey) Functional response and prey-switching P eat another prey eat this prey N(this prey) P KN N (this prey)
Intertrophic Dynamics Switch of prey At low N there’s no effect of predator Degree of DD determines level Functional response and prey-switching P eat another prey eat this prey N(this prey) P Independent of prey (DD still in work) P KN N (this prey) N (this prey)
Intertrophic Dynamics Predator isocline (high DD) Stable pattern with prey density below carrying capacity Functional response and prey-switching BHT: fig. 10.9 Predator isocline Prey isocline
Intertrophic Dynamics Combining DD in predator and prey BHT: fig. 10.7 Predator isocline Prey isocline Less effecient predator Predator isocline Prey isocline Strong DD in predator Prey isocline Predator isocline Functional response and prey-switching Many other combinations! Despite initial settings they all become stable!
Intertrophic Dynamics Crowding in practice Indian Meal moth Heterogeneous media Log density Structural simple media time BHT: fig. 10.4
Intertrophic Dynamics Crowding in practice Indian Meal moth Intrinsic and extrinsic causes of population cycles (fluctuations) Heterogeneous media Structural simple media
Intertrophic Dynamics Population cycles and their analysis
Intertrophic Dynamics lynx + Sunspot Lynx – hare interactions • pattern: the distinct 10-year cycle (hunting data!) • processes?: obscure! • hypotheses: (1) vegetation-hare (2) hare-lynx (3) vegetation-hare-lynx (4) sunspots
Intertrophic Dynamics - Lynx – hare interactions • pattern: the distinct 10-year cycle (hunting data!) • processes?: obscure! • hypotheses: (1) vegetation-hare (2) hare-lynx (3) vegetation-hare-lynx (4) sunspots lynx Sunspot
Intertrophic Dynamics + Lynx – hare interactions • pattern: the distinct 10-year cycle (hunting data!) • processes?: obscure! • hypotheses: (1) vegetation-hare (2) hare-lynx (3) vegetation-hare-lynx (4) sunspots lynx Sunspot
Intertrophic Dynamics Lynx – hare interactions: The Kluane Project Factorial design large-scale experiment: (1) control blocks (2) ad lib supplemental food blocks (3) predator exclusion blocks (4) 2+3 blocks • monitored everything over 15 years (species composition, population dynamics, life histories ...)
Intertrophic Dynamics (-pred, + food) (-pred) • Non-additive response (+food) 10-fold (control) Hare density year Vegetation-hare-predator • Increased cycle period ... Lynx – hare interactions: The Kluane Project … but neither food addition and predator exclosure prevented hares from cycling - Why?
Intertrophic Dynamics Lynx – hare interactions: A spatial perspective NAO Openforest Continental Atlantic Closed forest Pacific Forest/Grassland
Intertrophic Dynamics f(Nt-1,Nt-2) increase Nt = density f(Nt-1,Nt-2) decrease year Lynx – hare interactions: the lynx perspective Kluane indicates that hare-predator interactions are central. Nt = f(Nt-1,Nt-2,..., Nt-11)!... … dynamics non-linear! High dependence (80%) on hare density ... hare lynx
Intertrophic Dynamics Lemmus Clethrionomys 27 populations Microtus BHT: fig. 15.13 A geographical gradient in rodent fluctuations: a statistical modelling approach Ottar Bjørnstad Effect of predators? Bjørnstad et al. 1995 Hanski et al. 1991
Intertrophic Dynamics • The specialist predator hypothesis • (predator numerically linked to prey, that is through reproduction; variations come from variations in predator efficiency) Lemmus Clethrionomys • The generalist predator hypothesis • (more generalist predators in south than north) Microtus AR(2): Nt = f(Nt-1,Nt-2) AR(1): Nt = f(Nt-1) efficiency no of pred BHT: fig. 15.16 A geographical gradient in rodent fluctuations: a statistical modelling approach Two hypotheses delayed effect on prey direct effect on prey Analysis of prey population dynamics: Bjørnstad et al. 1995 Hanski et al. 1991
Intertrophic Dynamics Lemmus 17 (89%) time series best described by: Clethrionomys AR(2): Nt = f(Nt-1,Nt-2) Nt-2 Microtus Nt-1 A geographical gradient in rodent fluctuations: a statistical modelling approach Ottar analysed 19 time series (>15 years) using autoregression (AR): Increasing no of gen pred increases the direct negative effect on prey The generalist predator hypothesis Bjørnstad et al. 1995
Metapopulation and Intertrophic Dynamics Combining metapopulation and predator-prey theory BHT section 10.5.5 Comins et al. (1992) The spatial dynamics of host-parasitoid systems. Journal of Animal Ecology61, 735-748