Download

1 / 2
20 likes | 41 Vues
Investment in stock market is one of the best options to consider when it comes to achieve investment objectives. It is one of the oldest investment avenues for both short and long term investors. Read the blog to know more about technical analysis of stock charts.

E N D
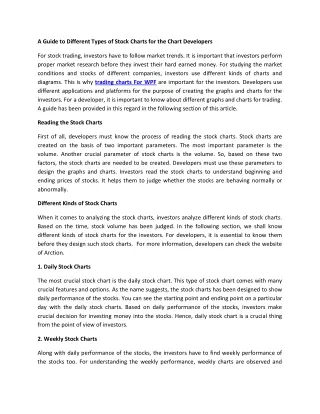
Blog1: equity99.com A Beginners Guide to Technical Analysis of Stock Charts We all know that investment in stock market is one of the best options to consider when it comes to achieve investment objectives. Indeed, it is one of the oldest investment avenues for both short and long term investors. Investment Requires Considerable Expertise However, stock market is very risky and fluctuates very abruptly. That is why it makes sense to understand the basics of stock market and its technical aspects, as well. Technical analysis not only helps investors to understand the fundamentals of a company, but also enable them to make meaningful decisions. According to an expert, technical analysis is the study of price and volume changes of a stock over time. It is quite broad and involves the use and study of financial charts. Most people believe that only a technical analyst can understand and interpret financial charts; however, in reality, anyone can read, understand and interpret technical charts.
Blog1: equity99.com Today, there are many innovative tools available that helps investors to analyze price and volume movement as well as the trend of a particular stock. As an investor, you should mainly focus on technical analysis of stock charts because it eventually helps you to know three things – What to invest in, when to buy and when to sell. Besides all these, technical charts can reveal a wide range of aspects and provides greater opportunities for better and more profitable trades. It also helps to track price and volume of a specific stock for sell signals. There are two types of research – Fundamental Research Technical Research to analyze data Most people only use technical analysis to know the trading range of a stock; however, it must be noted that it should also be used to trend, pricing fluctuations, minor and major up & down trends along with the patterns. (Uptrend – positive slope, Downtrend – negative slope) Conclusion If you are beginner, you should know how to interpret trend lines. Whether you are a long-term or short-term investor, you should always focus on technical analysis. To sum up, you should always consider technical analysis before investing. Today, experienced investment advisory agencies have expert research analysts who develop and provide solid and insightful technical analysis reports for investors to improve their knowledge. The reports contain deep analysis, market data, important financial parameters, in-depth analysis of companies and financial performance, global trends, result updates and major gainers and losers, etc.