Download
1 / 22
220 likes | 252 Vues
Picking the direction of share prices is one of the most important skills a trader or an investor can have. This eBook starts with the basics with an overview of technical analysis, fundamental analysis, and an introduction to charting.

E N D
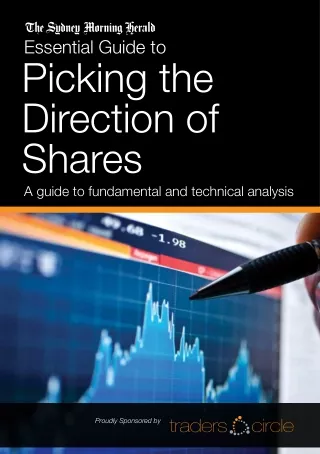
Essential Guide to Picking the Direction of Shares A guide to fundamental and technical analysis Proudly Sponsored by
To order your free copy of this or other Essential Guides, go to www.smhshop.com.au/freeguides Guide design by mosaiccollective.com Important information The Sydney Morning Herald Essential Guide to Picking the Direction of Shares is published and distributed by Fairfax Media Publications Pty Ltd, ABN 33 003 357 720, the publisher of The Sydney Morning Herald. It is intended to provide general information of an educational nature only. Any information contained in this guide does not have regard to the financial situation or needs of any reader. Neither the publisher, Fairfax Media Publications Pty Ltd, nor the sponsor, TradersCircle, ABN 65 120 660 497 which is a corporate authorised representative of Emerald Financial Group AFSL 241041, intend by this guide to provide financial product advice and information in the guide cannot be relied upon as such. All readers should consider obtaining independent advice before making any decisions concerning financial products or services. All information correct at time of Publication (April 2010). To have The Sydney Morning Herald home delivered phone (02) 9282 3800. General Editorial enquiries store.help@smh.com.au
Essential Guide to Picking the direction of shares A guide to fundamental and technical analysis Contents Introduction 2 What drives growth? 3 The analytical techniques on offer 3 Types of charts 10 ‘The trend is your friend’ 12 Common patterns 14 What’s the best approach? 18 A final word on portfolio construction 20
Introduction Share ownership in our country is among the highest per capita in the world. Many Australians first became shareholders by default as a result of receiving shares in companies such as the NRMA or AMP when they floated, while others initially bought shares in the heavily promoted privatisation of Telstra. For many it has since become a preferred path to building long-term financial security. So what is so good about shares? Shares – which quite literally represent a share, or portion, of a company – are a growth asset. This means that besides their potential to generate income in the form of dividends, they also offer the chance of capital growth; increasing the value of your initial investment. In this way, like property, they can help combat inflation, or the slow creep of rising prices that erodes the value of your money. This is something that asset classes such as deposits and fixed income investments cannot do. But there is a downside to this additional profit potential: you have to take on additional risk. Just as share prices can go up, they can also go down. This was demonstrated all too clearly in the global financial crisis when sharemarkets around the world plummeted and billions of dollars were wiped off the value of shares. However, some shares weathered the financial storm better than others, and some have already surged above their previous highs. The trick to investing is to identify those shares that are going to withstand the pressures – and grow your money. 2
What drives growth? Two broad variables are considered to influence growth: macro-economic factors and micro-economic factors. Macro-economic factors are the big picture influences that exert a top-down effect on share prices. These include such variables as the prevailing economic conditions, the outlook for a particular industry sector and market sentiment. For example, if the economy is in recovery mode and consumer sentiment indicators show that people are getting set to reopen their wallets and spend up big, you might look to buy discretionary retail stocks such as Harvey Norman. Conversely, if growth is subdued and consumer sentiment poor, you might favour non-discretionary retailers such as Woolworths. When considering specific stocks, it is also important to consider micro-economic factors, which will impact on the share price of that particular company. These include such variables as profit results, company news and announcements, and management strength. There are a plethora of factors you could consider here, some of which we will look at later. Macro-economic and micro-economic factors can be considered together to select shares. For instance, once you have identified a sector with growth potential using big picture, macro-economic analysis, you can look at individual company specifics to narrow your choice to those individual stocks offering the greatest chance of delivering that growth. Here’s how... The analytical techniques on offer The techniques for choosing shares broadly fall into two categories: fundamental analysis and technical analysis. Fundamental analysis is basically number crunching. It involves using information gleaned from company results and announcements to make a call on whether the share price is poised for growth. Figures contained in these communications can be used to calculate ratios that indicate whether the stock is fairly valued, how much the company is returning to shareholders and the strength of its balance sheet. Micro-economic analysis usually relies heavily on fundamental ratios. Technical analysis is different altogether. In its purest form, it involves making all buy and sell decisions on the basis of share charts, with no regard for what a company is or does. The price charts used might, for example, be simple line graphs based on closing share prices, or they may be more complex representations, showing not just closing prices, but also opening prices and the price range within that period in an effort to more accurately identify a price trend. Volume – or how many shares have been bought or sold – is also sometimes depicted. 3
It is calculated by dividing a company’s net profit after tax by the number of shares on issue. Example: Company XYZ earned $1 million in net profit for the year and has 1 million shares. 1,000,000 / 1,000,000 = $1 earnings per share So for each share on issue, XYZ is earning $1. The measure can be based on forecast profit for the current year or a future year – called estimated earnings per share – or on profit already declared, that is, historic earnings per share. As with most sharemarket ratios, the change in earnings per share over time is more telling than a simple snapshot. Naturally investors should be looking for earnings per share to be growing rather than falling – and steadily so. Rapid earnings growth can be positive provided it flows through to earnings per share. Fundamental analysis basics The building blocks of fundamental analysis include a company’s share price, its market capitalisation or size, its earnings and dividends. Pricing information is freely available on the Australian Securities Exchange website, www.asx.com.au, and is also published in many daily papers. These sources also calculate and list some of the simpler fundamental ratios. Information needed to calculate other ratios is contained in company reports, which can most easily be found on the company’s website. In this introduction to fundamental analysis, we will look at commonly used ratios that measure a company’s valuation, its growth, its income and its rate of return. Earnings per share The earnings per share ratio (EPS) tells you the amount of a company’s earnings that can be attributed to each individual share held. As such, it allows investors to directly compare one potential stock investment with another. 4
Price/earnings ratio The price/earnings ratio (P/E) is the most popular way of determining whether a company’s shares are over-valued, fairly valued or under-valued. Naturally investors try to find one that is the latter. The ratio is calculated by dividing a company’s share price by its earnings per share. The earnings per share figure can be either estimated or historic, giving an estimated forward, or historic price earnings ratio. Example: Company XYZ shares are trading at $10 and the company has historic earnings per share of $1. 10 / 1 = 10 So XYZ has a historic price earnings ratio of 10. Note that this is not a currency amount or percentage, but a multiple. The lower the P/E, the cheaper the stock. However, a company with a high P/E might have good growth prospects. In any case, in isolation a P/E ratio means nothing; for a meaningful analysis you need to consider it next to its peers. Some industry sectors routinely carry much lower or higher P/Es than others, and this can change throughout the economic cycle (for example, cyclical stocks, such as those in the automotive or travel industries tend to experience big changes in earnings in response to the trading conditions). It is also important to remember that income stocks, those which offer high dividends, can trade on a lower P/E than their high-growth counterparts. Smaller or newer companies will also tend to carry a lower P/E than larger, more established ones, as the market is not yet convinced about them. Finally, start up companies may not yet have any earnings, and therefore no P/E. Most importantly, before applying the P/E valuation technique, you need to think about the nature of the stock. If Company XYZ is trading on a P/E of 10 while other companies in the same industry sector have an average P/E of 15, it might be considered under-valued or cheap. But you then need to consider why it is cheap. Is it a stock with unrecognised potential and therefore one that merits further investigation? Or is it simply a bad company? P/E growth Another useful valuation method which may help shed light on whether a stock is expensive or cheap is the P/E growth – or PEG – ratio. You calculate the PEG ratio by dividing the P/E multiple by the expected rate of growth in the earnings per share. A PEG ratio of 1 implies a stock may be fair value; a figure closer to 2 suggests it might be over-priced. Example: Company XYZ has a P/E of 10 and an expected rate of earnings per share growth of 10 per cent. 10 / 10 = 1 In this case Company XYZ may indeed represent a good, inexpensive buy. But, of course, there’s more to analysing a stock than just the share price. 5
Dividend yield The dividend yield relates a company’s dividend per share figure to its share price, to give you the income return on your investment. It also lets you compare that return, on a like for like basis, with other stocks. The dividend yield is calculated by dividing the dividend per share by the share price. The figure is then multiplied by 100 to arrive at a percentage. Example: Company XYZ has a dividend per share of $1 and is trading at a share price of $20. 1 / 20 = 0.05 or 5% So the dividend yield is 5 per cent. When comparing this figure with other potential sharemarket investments, bear in mind that some sectors – such as banks – typically carry higher yields than others. It is also important to remember that share prices and dividend yields have an inverse relationship. So a company that has suffered a dramatic fall in its share price will show a sudden rise in its dividend yield. Of course, the share price could have further to fall, and the company’s ability to maintain its dividend payments might be in doubt. So be sure to check how the share price has been moving before investing on the basis of a high dividend yield. Dividend per share Many investors consider dividends the key to making money over the long-term and, where capital growth is flat, they certainly buoy returns. Reliable dividends – paid each and every year and maintained at least at their previous level, but preferably increased – are a hallmark of a healthy company with good profit growth. Conversely, frequent dividend cuts, or even the suspension of dividends, indicate that an operation is not producing enough cash and could be an early sign of trouble. The dividend per share ratio is calculated by dividing the amount a company has set aside for dividends by the number of shares on issue. The dividend figure can be calculated either before or after tax to give the gross or net dividend per share. Example: Company XYZ has a net dividend pool of $1 million and 1 million shares. 1,000,000 / 1,000,000 = $1 So the net dividend is $1 per share. Generally companies pay shareholders two dividends per year, an interim dividend and a final dividend. 6
comfortably maintain that dividend level in the future. Let us now look beyond dividends to the rate of return. Dividend payout ratio and dividend cover It is not enough to satisfy yourself that a company is simply maintaining its dividend payments, though. You should also look at where these dividends are coming from, by considering the company’s dividend payout ratio and dividend cover. To be sustainable, dividends need to come from earnings, not from borrowed money, new share issues or from asset revaluations. The dividend payout ratio is calculated by dividing a company’s dividend per share by its earnings per share. Example: Company XYZ has a dividend per share of $1 and earnings per share of $2. 1 / 2 = 0.5 or 50% This tells you the percentage of a company’s earnings paid to shareholders as dividends – in this case, half – which indicates how well dividends are supported. If the figure is more than 100 per cent, the money must be coming from somewhere other than earnings, and it is important to find out where. The more established the company, the higher the dividend payout ratio tends to be; younger, growing companies usually prefer instead to invest earnings back into the business. Dividend cover is calculated by dividing earnings per share by dividend per share. In other words, it is the inverse of the dividend payout ratio. Example: Company XYZ has earnings per share of $2 and a dividend per share of $1. 2 / 1 = 2 So XYZ’s earnings are sufficient to cover its dividend payment twice over, an indication that the company should be able to Return on equity Return on equity is considered an important indicator of a company’s use of shareholder funds. A high return on equity implies management is using shareholder funds well; a low one implies the opposite. Return on equity is calculated by dividing profit after tax by shareholder equity (total assets minus total liabilities). Again it is expressed as a percentage Example: Company XYZ has a net profit of $10 million and shareholder equity of $50 million. 10,000,000 / 50,000,000 = 0.2 or 20% This percentage figure is useful in comparing one company’s returns against others in the same industry sector. Many investors look for a return on equity of at least 10 per cent over time, and this is certainly indicative of a company that uses shareholder money effectively. A rising return on equity usually translates into a rising share price, while a falling return on equity usually means the opposite. 8
Technical analysis basics As mentioned earlier, technical analysis relies not on company details, but on share price charts, and the formations and patterns they make. Chartists interpret these historic movements looking for guidance to the future direction of the share price. The rationale is that a chart illustrates the psychology of the market, which is essentially a tug of war between fear and greed. Know what you are looking for, they say, and the charts will tell you when to buy and sell. The tools of a chartist’s trade are data and software packages. Some basic charting tools are freely available on the internet, while investors wanting to focus on technical analysis in a more serious way can buy more detailed analysis packages offered by commercial providers. Charting is a complicated subject. In this guide we will touch on a few basic concepts, including trend lines, support and resistance lines, and the formation of ascending and descending triangles. But first we need to take a closer look at the various types of charts. Return on assets This measure, which indicates the profitability of a company based on its total assets, including borrowings, provides a good indication of how effectively management is using those assets to generate earnings. Return on assets, also known as return on investment, is calculated by dividing a company’s profit after tax by its total assets (including borrowings). Note that if a company has no debt, the return on assets will equal the return on equity. Example: Company XYZ has net profit of $10 million and total assets of $100 million. 10,000,000 / 100,000,000 = 0.1 or 10% The higher the percentage, the better, as this suggests the company’s assets are working harder for investors. But because return on assets vary significantly between industries and from company to company, it is important to compare it only with a stock’s previous return on assets or with similar stocks. That’s a brief explanation of some of the more common ratios used in fundamental analysis. Let’s now turn to look at the basics of technical analysis as a stock selection technique. 9
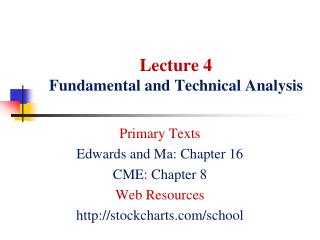
Types of charts Chartists use several different chart types. Three of the more popular are the OHLC chart, candlestick chart and basic line chart. OHLC Chart OHLC stands for the open, high, low and close price – which are represented on each bar of the chart (see inset, right). Quite simply, each bar shows the open and close prices and the share price range in any given period. If the share price closes on or near the low, it is considered that sellers are in control, and if it closes near the high, it is considered that buyers are in control. An example of a chart formed by daily bars is below. Open High Low Close Price Bar High Close (current price) Open Low 10
Candlestick Chart Candlestick charts are thought to have been first used by Japanese rice traders around the 16th century to identify price trends. Today, proponents of this chart type think it can more accurately pinpoint whether buyers or sellers are in control of a stock. In the candlestick chart below, a green candle represents that buyers are in control, that is that the share price closed near its high, while a red candle indicates that sellers are in control, or that the share price closed near its low. Like OHLC charts, candles also depict open, high, low and close prices but some traders prefer them because they usually come with enhanced graphics. Line chart In contrast, line charts show just closing prices and quite simply join the dots (see below). As such, they offer the least information but are easiest to read. They can be useful when examined in conjunction with the other chart types. So just what can these various charts tell you about the future direction of a stock price? 11
‘The trend is your friend’ Prevailing sentiment gives a valuable clue as to what might happen next. The trend – as they say – is your friend. Chartists consider that the share price is likely to continue in the direction of a trend line. It is far safer to buy a share when it has rebounded 5 per cent than to try and pick a stock’s very bottom. If share price troughs and peaks are both rising over time, there is obviously an uptrend. But chartists prefer to see three consecutive higher troughs and three consecutive higher peaks before acting. They draw the trend line for an uptrend so it intersects the rising troughs (see below). And they draw the trend line for a down trend so it intersects the falling peaks (see below). 12
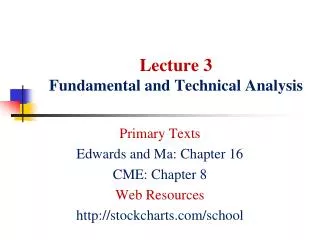
Support and resistance lines Beyond the simple trend indicators, technical traders consider the concepts of support and resistance key. A support line shows the lowest price at which investors will allow a stock to trade. In other words, the price is unlikely to fall below this level. The example below shows a stock with support at around $25.20. Chartists believe that if support is broken, the share price is likely to fall to the next level of support. The resistance line is the opposite of a support line. It shows the highest price at which investors will allow a stock to trade. In other words, the price is unlikely to rise above this level. Below you can see a stock that is hitting a resistance ceiling at $16.06. Every time it touches this level it is sold down and the chart falls away. Just as with a support line, if resistance is broken the share price will probably rise to the next level of resistance. 13
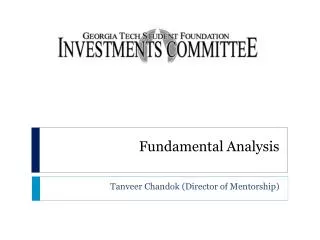
Common patterns Charts can be used to draw not just lines but also patterns that can shed light on when to buy and sell. We will next examine a couple of the most common patterns. The Pennant A pennant is seen particularly with stocks that are trending in one direction. It occurs where a rising line of support meets a falling line of resistance. The theory is that a pennant pattern is usually followed by some type of share price breakout as pent up momentum is released, much like releasing a coiled spring. In the first chart below, you can see a stock moving into the apex of the triangle – and in the second, the share price breakout. As such, technical traders consider a pennant a powerful signal to buy. 14
The ascending triangle An ascending triangle is formed when an uptrend approaches a level of resistance. As with a pennant, the share price range tends to become compressed as it moves towards the triangle’s apex, and so builds momentum. On the price breakout, you typically also see the same explosive move (see the charts below). Chartists argue that an ascending triangle is a more reliable signal of a price surge than a pennant as the stock is already trending up. 16
The descending triangle Here is how the opposite pattern, a descending triangle, looks. This is believed to precede a major downturn. So there you have it: a brief look at technical analysis and how its proponents use charts to determine investor sentiment towards a stock and, therefore, divine the future direction of its share price. Keep in mind, though, that technical analysis is a complex subject and it is important to do further reading and research to fully familiarise yourself with the tools and techniques for successful share trading. The Australian Securities Exchange (www.asx.com. au) offers a range of education options including free online courses on both technical and fundamental …analysis, while The Educated Investor bookshop (www.educatedinvestor. com.au) and the Australian Technical Analysts Association (www.ataa.com.au) are good resources for those wishing to delve deeper. The big question, however, is whether fundamental or technical analysis will produce the best sharemarket returns. 17
more. This short term strategy involves a heightened potential to lose money. Accordingly, to engage in share trading, you need to be willing to take on higher risk. Your share price entry and exit points will also be far more important than someone who is willing to ride out peaks and troughs over the longer term. So traders typically rely more heavily on technical analysis. Indeed, there are some who completely disregard a company’s other characteristics and look only to the charts to tell them what action to take. Again, the best approach will depend on you and your investment strategy. In the interests of prudence, however, you might consider a bit of both – fundamental analysis to identify potential investments and technical analysis to indicate when to buy and sell. What’s the best approach? The best approach for you – fundamental or technical analysis – will vary depending on whether you are an investor or a trader. An investor is someone who holds shares for the longer term, whether that be primarily to realise profits down the track or to receive dividends in the interim – or both. Most superannuants and people with DIY super funds fall into this category, as investing carries a lower risk than trading. With their lower risk profile and longer time horizon, investors are likely to place more emphasis on fundamental rather than technical analysis. Traders, by contrast, buy and sell shares more frequently in the hope of making a quicker buck. Dividends are usually of little interest (unless the strategy is specifically geared towards this) and shares can be held anywhere from minutes to a year or 18
companies in your portfolio, you also need to hold shares in a diversity of industries, spreading your investments across a decent number of the different sectors represented on the Australian sharemarket. It is also worth considering diversifying geographically – with a spread of international and Australian shares – so that a downturn just in our own market will not drag down your entire portfolio. Finally, be sure to review your portfolio regularly. This is important, both to identify shares that may no longer be appropriate to hold, and to keep track of those that may have grown to represent too large a proportion of your holdings. Regular portfolio rebalancing – selling down such shares in favour of others to maintain diversity – is crucial to a safe, successful portfolio. A final word on portfolio construction Regardless of whether you favour a particular analysis technique, or indeed a combination of both, be sure to conduct robust research. Good sources of information include The Australian Financial Review, the ASX website, and some stockbroker research. It is also vital that you consider how best to mitigate risk. One of the best ways is through diversification – spreading your money across several holdings so that a downturn in one will not decimate your wealth. The optimal number of stocks is a matter for debate, but generally 12 to 15 is considered appropriate where the total portfolio is worth $100,000 or more. Any fewer could leave you vulnerable to losses, while any more will see transaction costs eat into your returns. You also need to think carefully about the mix of the shares you choose. It is not enough just to include a diversity of 20