Download

1 / 41
460 likes | 1.13k Vues
Industrial Microbiology INDM 4005 Lecture 12 27/02/04. Continuation of Lecture 11. 5.1.4. Factors influencing oxygen supply 5.1.4. (a) process factors 5.1.4. (b) transfer through an interface (K La ) 5.1.4. (c) determination of K La ; 5.1.4. (d) factors affecting bubble size

E N D
Industrial Microbiology INDM 4005 Lecture 12 27/02/04
Continuation of Lecture 11 5.1.4. Factors influencing oxygen supply 5.1.4. (a) process factors 5.1.4. (b) transfer through an interface (KLa) 5.1.4. (c) determination of KLa; 5.1.4. (d) factors affecting bubble size 5.1.4. (e) gas hold-up : 5.1.4. (f) economics of oxygen transfer
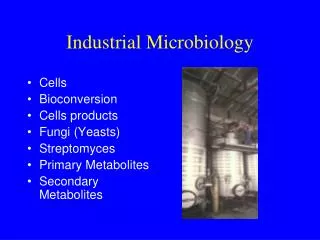
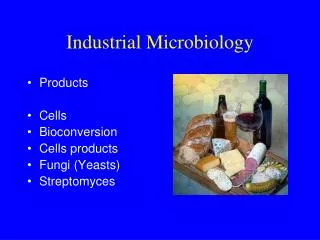
Oxygen supply • Oxygen is normally supplied to microbial cultures in the form of air, i.e cheapest source • Provision of oxygen varies with the scale of the process, compare lab and industrial process design • Oxygen mass balance depends on rate at which O2 can be delivered to the biological sysytem (OTR) and the rate at which it is utilised (COD) • OTR can be increased by elevating the pressure, enriching the inlet air with O2 and increasing agitation and aeration
Oxygen Transfer Rate • Rate of O2 transfer from air bubble to the liquid phase may be described as dCL = KLa (Csat - CL) dt CL = t = dCL = dt KL = a = Csat = Is the concentration of dissolved O2 in broth in mmoles L-1 Is time in hours Is the change in O2 conc over time in mmoles O2 L-1 hr-1 Is the mass transfer coefficient gas to liquid phase, (cm h-1) Is the gas/liquid interface area per liquid volume (cm2 cm-3) Is the saturated dissolved oxygen conc in mmoles dm-3
KLa KL = Is the mass transfer coefficient (cm h-1) a = Is the gas/liquid interface area per liquid volume (cm2 cm-3) These are difficult to measure individually and are generally linked to give KLa = volumetric mass transfer coefficient per hr Therefore KLa is a measure of the aeration capacity of a fermenter and must be maintained above a minimum critical level to satisfy oxygen requirements
5.1.4.(d) FACTORS AFFECTING BUBBLE SIZE (a) Influence of gas velocity on bubble formation: slow medium fast Slug Flow - flow alternates between high-liquid and high-gas composition.
b) Influence of liquid properties on bubbles; Liquid can change from A B when salts are added. Implication for mass transfer in different media. Will this property of liquids influence Kla - why?
5.1.4.(e) GAS HOLD-UP Represents air volume retained in the liquid Vh = V - V0 Where Vh = hold-up volume, V = vol. of gassed liquid, V0 = vol of ungassed liquid.
Correlations exist that relate hold-up to power input , for example, (P/V)0.4 . Vb0.5 P/V = power input per unit vol ungassed liquid, Vb = linear velocity of air bubble (ascending velocity). Ascending velocity of bubble (Vb): Vb = FHl/H0V Where H0 = hold-up of bubble, F = aeration rate, Hl = liquid depth, V = liquid volume.
CASE STUDY: Review the literature on determination of gas hold up. Show an application of optimising hold-up in a reactor i.e. through mixing or length to width ratio (increasing path length)
How does height (h) of a reactor vary with radius (r) when volume (v) is kept constant? volume of a cylinder is v = r 2 h Let us fix the volume as 1 then h = 1/ r 2 If r = 1 then h = 1/ r = 2 then h = 1/4 r = 3 then h = 1/9 Therefore as the radius increases the height (or path length) decreases as the square of the radius
5.1.4.(f) ECONOMICS OF OXYGEN TRANSFER Fermentation e.g Penicillin - high KLa Waste treatment - economy Kla . Csat = maximum rate at which oxygen can be dissolved Economy and capacity related through power input per unit volume (P/V) ECONOMY = KLa. Csat / (P/V)
CASE STUDY • Compare a pumped air, sparged system of aeration with a surface aerator (as used in waste treatment i.e. • What are the advantages of each system?
The balance between OXYGEN DEMAND and SUPPLY • Must consider how processes may be designed such that O2 uptake rate of the culture does not exceed the oxygen transfer rate of the fermenter • Uptake rate = QO2.X • QO2 = O2 uptake rate, X = Biomass • dC/dt = KLa(Csat - CL ) = supply rate • Dissolved O2 conc. should not fall below the critical dissolved O2 conc (Ccrit) • A fermentation will have a max Kla dictated by operating conditions thus it is the demand that often has to be adjusted. • Achieved by: • Control of biomass conc • Control of specific O2 uptake rate • Combination of both
Overview 5.2. Mixing and agitation 5.2.1. Measurement of mixing 5.2.2. Function of agitation - mixing assists oxygen transfer 5.2.3. Mixing patterns arising from agitator design /agitation etc 5.2.4. Types of impellers 5.2.5. Impeller design and reactor design 5.3. Fluid dynamics 5.3.1. Fluid shear rate 5.3.2. Non-newtonian fluids 5.3.3. Reynolds number (nre) 5.3.4. Reynolds number of an agitator 5.3.5. Relationship between power consumption and operating variables 5.4. Agitation / aeration and scale-up
5.2. MIXING and AGITATION 5.2.1. Measurement of mixing; Measure degree of mixing using residence time distribution (RTD) of a tracer dye e.g. Residence time distributions are important when calculating scale-up factors (Is the mixing of equal quality in two different sizes /types of fermenter?)
Residence time distributions are important when calculating scale-up factors Measure conc of dye Up-flow reactor with substrate added at the base of the reactor, product etc exits at the top Add dye as a pulse Examine pattern of appearance of the pulse of dye in exit stream I.e plot concentration versus time T T T T Plug flow Normal Channelling Back mixing
5.2.2. FUNCTION OF AGITATION - Mixing assists Oxygen transfer (a) Increases interfacial area (between gas and liquid) by dispersing air in the form of small bubbles (b) Increases hold-up time of bubbles in the liquid (c) Prevents coalescence of air bubbles (d) Decreases thickness of interfacial area The degree of agitation in a STR is a function of; design of agitator, Rheology / power /energy input
5.2.3. MIXING PATTERNS ARISING FROM AGITATOR DESIGN /AGITATION etc. Axial flow Radial flow Propeller Impeller Influence of baffles Vortex fermenter High Density Low Density Bubbles impart velocity Air
5.2.4. TYPES OF IMPELLERS Disc turbine - most usual, vaned disc open turbine (variable pitch) CASE STUDY: Draw each type of impeller P125 Stanbury & Whitaker
5.2.5. IMPELLOR DESIGN AND REACTOR DESIGN Impellor diameter and spacing Rotational speed (tip speed) Geometry e.g. size of blade Position of impellor Spacing: Di < Hi, 2Di Number (HL - Di)/Di > Number of impellors > (HL - 2Di)/Di Di = impellor diameter Hi = spacing HL= height of liquid in fermentor Relationship between diameter and tip speed - see REYNOLDS NUMBER This influences the level of shear experienced by a cell.
Case study Design an impeller type agitation system for a 1000l fermenter used to grow bacteria
5.3. FLUID DYNAMICS • In liquid culture the fluid flow or rheological behaviour have a major impact on mass transfer • Fluids may be described as Newtonian or non-Newtonian depending on whether their rheology (flow) characteristics obey Newtons law of viscous flow Fluid viscosity = shear stress or force per unit area shear rate or velocity gradient
A rheogram of a Newtonian fluid Plot of shear rate against shear stress Shear stress Slope = viscosity Shear rate The viscosity of a Newtonian fermentation broth will not vary with agitation rate
Rheograms of fluids of different rheological properties Bingham plastic Newtonian fluid Pseudoplastic Shear stress Casson body Dilatant Shear rate However, a non-Newtonian liquid which does not obey Newtons law of viscous flow will vary depending on shear rate i.e agitation rate
Ratio of velocity head to pumping + shear rate of fluid (is the velocity gradient) This concept important when dealing with large cells subject to shear damage plant cells require large, slow impeller i.e. Bacteria Plant cell
Fluid shear rate Fluid shear stress (= applied force) is Viscosity X Fluid shear rate (ratio of shear stress to shear rate = viscosity in Newtonian fluid). In a general way one can think of viscosity as "resistance to mixing" (i.e stir a jar of molasses compared with jar of water !) See plots of Shear stress to shear rate for Pseudoplastic (viscosity decreases as force is applied), Bingham plastic (once fluid yields viscosity is constant) , Newtonian (viscosity is constant - i.e. slope).
Case study: Outline the problems encountered in growing fragile cells and what strategies are used to optimise productivity
5.3.2. NON-NEWTONIAN FLUIDS Many fermentation broths (e.g. mycelial, polymer production etc.) are NON-NEWTONIAN FLUIDS (like Bingham plastic or Casson). Viscosity significantly alters with time (e.g. t0 approaches Newtonian, t100 is Non-Newtonian). See the effect of P. chrysogenum mycelia on Kla. Culture alters physical aspects such as mass transfer
5.3.3. REYNOLDS NUMBER (NRe) Relates to flow of liquids (motion). Flow of liquid over a stationary surface may be considered as movement of an infinite number of fluid layers each moving with a velocity that increases with distance from the surface Reynolds number is a function of the ratio of turbulent to viscous (fluid) force. i.e NRe = (linear velocity x density x linear dimension) / viscosity can be used when any force is applied to a liquid.
5.3.4. Reynolds number of an agitator NRe is a function of the ratio of turbulent to viscous flow NRe = (ND2 )/v N= agitator speed, D = diameter of impellor, = density of liquid, v = viscosity. Low number ( 1 - 15)= laminar flow up to approx 3 x 10 3= transitional range above= turbulence
Example: Fermenter system type of agitation for (a) water and (b) polymer (a) Water; viscosity = 0.001(1 centipoise) NRe = ND2 x 100 Low N or D values give NRe > 3 x 10 3 (turbulence - good mixing) (b) Polymer; viscosity = 100 (10,000 centipoise) NRe = ND2 100 Much higher N or D required to give values > 3 x 10 3 (i.e. turbulence)
5.3.5 Relationship between power consumption and operating variables Power number = Np = P / (N3D5) Represents power absorbed during agitation of non-gassed liquids. Plot of Np versus NRe (log - log plot) gives the Power curve which is divided into 3 regions Laminar or viscous flow Transition zone Turbulent zone - normally this is the required state
From this, one can predict the necessary power to give a specific level of mixing (or adequate mixing - should be relatively constant at NRe> 4 x 10 3) This Power curve developed by Rushton used ungassed systems thus not typical of aerators - aeration contributes to mixing. Michel and Miller developed an empirical correlation for gassed power consumption - Pg = k (P2ND3/Q0.56) 0.45this incorporates a function representing aeration rate and can be used to predict power consumption in gassed systems. More recent correlations are also available e.g Humark (1980).
Correlations between KLa and power exist for example, KLa = k(Pg/V) 0.95 Vs0.67 the figure 0.95 can vary with scale 0.95 - Lab, 0.67 - Pilot, 0.5 - Plant. This incorporates parameters such as liquid volume (V), superficial air velocity (Vs) and if one substitutes the Michel and Miller equation for Pg one then relates to impellor design (N and D) and the volumetric air flow rate (Q). Also illustrates how Kla is affected by consumption of power and degree of agitation.
This illustrates the "scale-up" window defining the operating boundaries for aeration and agitation in the scale-up of a typical fermentation. Problems that may arise: ACTION RESULT Minimise aeration CO2 and O2 levels Maximise aeration Foam formed Minimise agitation Bulk mixing poor Maximise agitation shear, cost increased
Sulphite reduction For each of the following statements, select appropriate methods of KLa determination from the list provided. 1) The KLa value is considered a characteristic of the bioreactor rather than the fermentation process 2) Requires measurement of gaseous O2 content 3) Requires multiple measurement of dissolved O2 concentration 4) Only one parameter has to be measured 5) O2 saturating concentration must be known 6) Method influenced by response time of dissolved oxygen sensor Oxygen balance, sulphite reduction, dynamic gassing out Page 193, In vitro cultivation of microorganisms Oxygen balance Dynamic gassing out Dynamic gassing out Oxygen balance and sulphite Dynamic gassing out
Summary • Agitation of suspended cell fermentations is performed to mix the three phases within a fermenter • Transfer of O2 into liquid broth is enhanced by agitation • Agitation promotes retention of air bubbles in suspension, reduces bubble size, prevents bubble coalescence • Important to get correct shear conditions • Fermenter agitation requires substantial input of power • Understand Newtonian and non-Newtonian liquids • Understand Reynolds and Power Numbers, Power curve