Manhattan East Side Access Project Second Avenue Subway
Manhattan East Side Access Project Second Avenue Subway PEA Team: Jay Horwitz Bryan Mullins Muyiwa Teriba May 3, 2004 Overview of Presentation I. Introduction II. Funding and Finance III. Costs IV. Benefits V. Synthesis INTRODUCTION What is SAS?


Manhattan East Side Access Project Second Avenue Subway
E N D
Presentation Transcript
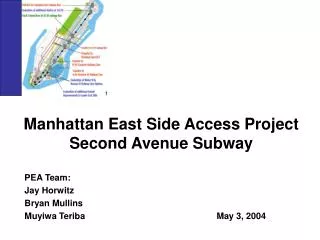
Manhattan East Side Access ProjectSecond Avenue Subway PEA Team: Jay Horwitz Bryan Mullins Muyiwa Teriba May 3, 2004
Overview of Presentation I. Introduction II. Funding and Finance III. Costs IV. Benefits V. Synthesis
What is SAS? • 8.5 mile subway project from 125th Street to the financial district in Lower Manhattan • Will include 16 new stations along path under Second Avenue • Purpose to provide faster travel for current transit riders and relieve severe overcrowding conditions on Lexington Avenue line • Construction time estimated to start in 2004 and last 17 years
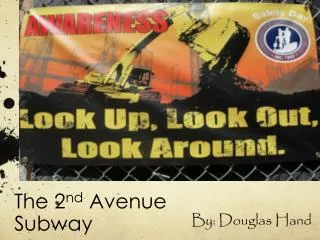
On the Table for Nearly a Century • Population density of East Side increased dramatically at turn of century • Proposals to build north-south subway line along Second Avenue date back to 1929 • During 1960s a two-track subway line from the Bronx to Lower Manhattan resulted in construction of several tunnel segments • However, construction suspended in 1970s due to City’s financial crisis
Transportation Problems have Renewed Interest in SAS Proposal • Lexington Avenue express service (4/5/6) operates with passenger loads that exceed New York City Transit guidelines • Overcrowding expected to increase • Access (1/4 to 1/2 mile) to subway service is lacking on farEast Side of Manhattan • Overcrowding lengthens trip times and causes service delays • Majority of rush hour buses are crowded and travel speeds are slow due to traffic congestion • Severe traffic congestion on local streets and FDR Drive contribute to New York City’s inability to meet National Ambient Air Quality Standards
SAS Wins Favor Among Officials, Community Groups, General Public • No-Build Alternative: Examined future impacts of inaction • Transportation System Management (TSM) Alternative:Bus service improvements • Build Alternative 1: New subway line under Second Avenue from 125th Street to 63rd Street with connection to Lower Manhattan via Broadway subway line • Build Alternative 2: 125th Street to 63rd Street subway line with addition of light rail transit line linking Lower East Side to Union Square and Lower Manhattan • Build Alternative 3: Full-length Second Avenue Subway from125th Street to financial district in Lower Manhattan
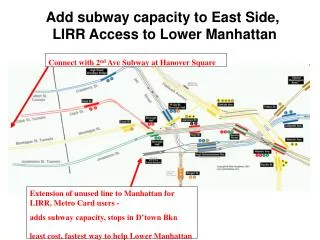
Map of SAS and System Interconnection Source: MTA MESA Study, “Supplemental Draft Environmental Impact Statement,” April 2001
Project Funding: Preliminary Consideration and Commitment Source: MTA, FTA
Where are we in the process? Est. 17 years ? Construction X Final design X Preliminary engineering X X X Environmental Analyses 2001 2002 2003 2004 2005 2021 Decision Pending X : Federal approval received
Costs Overview • $1.05 billion for 2000-2004 Capital Program • $728 million for 2000-2004 Capital Program personnel costs • $16.8 billion total capital cost from 2004-2021 • $16.18 billion for project management, design, construction, right-of-way • $624.9 million for rolling stock • $348.6 million annual operating cost starting in 2021 over 50 years at 2004 present value of $2.8 billion • $1.13 billion cost per mile • $210 incremental cost per incremental rider* * This figure is exceptionally high because of the difficulty of attracting new transit riders in a market in which the majority of commuters already use transit. Source: Annual Report on New Starts 2003 (November 2002), LowerManhattan.info
Elements of $16.8 bn Total Capital Cost • Northbound and Southbound twin tunnels (8.5 miles each) • 16 new stations • 30-35 fan plants • Numerous pump rooms • Electrical power substations • 1-2 new or expanded train storage and maintenance yards • Connections to existing stations Source: PEA Team Research
2000-2004 Capital Program Allocates $1.05 Billion for SAS $154,662,961 $270,337,039 Final Design Preliminary Engineering $625,000,000 Construction Source: MTA Capital Construction, March 2004
2000-2004 Capital Program Also Yields Personnel Costs $728 mn(average annual increase of 3.8%) 2000 2001 2002 2003 2004 Note: The MTA did not disclose assumptions regarding changes in staffing levels Source: Metropolitan Transit Authority
Cost-Per-Mile of Major Transit Projects Shows Magnitude of SAS $1.13 bn SAS 2001 Dollars $300 mn Los Angeles Red Line $197 mn D.C.Metro $152 mn MARTA(Atlanta) $81 mn Bay Area Rapid Transit 1970s 1980s 1990s 2004-2021 Source: Common Patterns, PEA Team Research
PHASE 1 PHASE 2 PHASE 3 $1,778,000,000CapitalProgram(Sunk Cost) $16,804,900,000Total Capital CostPV 2004* = $11,144,679,758 $348,600,000 Annual Operating Cost Over 50 YearsPV 2004** =$2,776,598,933 2000Capital ProgramStart 2004SAS ConstructionStart 2021SAS Opening 2071 Cost Timeline * $16.8 bn figure distributed evenly over 17 years; PV of annuity formula using 17 years, 5% interest rate** Present value discounted back 17 years to 2004 at 5% interest rate Source: PEA Team Research
Baseline Cost Figure * Figures in 2004 PV dollars Source: Annual Report on New Starts 2003 (November 2002), LowerManhattan.info, PEA Team Research
Benefits (Qualitative Overview) • New York City’s Economic Priorities: • Retain/Expand diversified workforce • Improve competitiveness in economic cycles • Improve growth in outer boroughs • Improved commute to Manhattan, which generates more than one-third of wages and one-quarter of jobs in tri-state region • 70,000 full-time jobs created during SAS construction • 600,000 riders will experience shorter commutes/time savings • Auto trips reduced by 30,000 per day • Improved security of transit network Source: The Economic Benefits of the Second Avenue Subway, December 2003, Regional Plan Association; Transportation Choices and the Future of the New York City Economy 2003/2004, Partnership for New York City
Benefits (Quantitative Overview) • $7 billion gain in wages • $7.4 billion gross increase in city’s productivity • $1.26 billion in benefits from time savings • $319.1 million in ridership Source: The Economic Benefits of the Second Avenue Subway, December 2003, Regional Plan Association; Transportation Choices and the Future of the New York City Economy 2003/2004, Partnership for New York City
Methodology for Estimating Benefits + + Source: The Economic Benefits of the Second Avenue Subway, December 2003, Regional Plan Association; Transportation Choices and the Future of the New York City Economy 2003/2004, Partnership for New York City
Total Benefits • $21.02 billion comprising: • $12.62 billion in economic development benefits including job growth, commercial development and residential development • $8.4 billion in transportation benefits including time savings and ridership **Figures cover a 50-year period Source: The Economic Benefits of the Second Avenue Subway, December 2003, Regional Plan Association; Transportation Choices and the Future of the New York City Economy 2003/2004, Partnership for New York City
Benefits Critique Jobs • 70,000 jobs from SAS over 17 years worth $1,000,000 per job • No explanation of where these jobs will come from • New jobs, or job movement/reallocation? • What kind of jobs? Value? • 22,500 direct construction jobs estimated, majority of which will be short term in nature • No reference to jobs lost resulting from construction • No analysis of net jobs created (some jobs will be permanently lost due to subway, e.g. taxi drivers) Source: The Economic Benefits of the Second Avenue Subway, December 2003, Regional Plan Association; Transportation Choices and the Future of the New York City Economy 2003/2004, Partnership for New York City
Benefits Critique Time Savings • Estimated $1.26 billion in time savings • No discussion or analysis of how much of this time savings value will be translated into dollars • No estimation of “net” time savings taking into account time wasted as a result of delays caused by construction • Time savings valued at today’s estimation to time value Source: The Economic Benefits of the Second Avenue Subway, December 2003, Regional Plan Association; Transportation Choices and the Future of the New York City Economy 2003/2004, Partnership for New York City
Benefits Critique Changes to “Time Savings” Benefits vs. Source: The Economic Benefits of the Second Avenue Subway, December 2003, Regional Plan Association; Transportation Choices and the Future of the New York City Economy 2003/2004, Partnership for New York City
Context: This Project Must Inevitably Compete for Scarce Resources • Total New York City budget FY2005: $46.9 billion • SAS equals a non-trivial fraction • Financial pressure on City anticipated • Budget deficits expected to range from $3.7 billion to $4.2 billion annually from 2006-2008 • Debt service increases from $2.4 billion in 2004 to $4.3 billion in 2008 • However, New York City pays $11.4 billion more in federal taxes and $2.6 billion more in state taxes than it receives in funding* * 1999 FY analysis
What should we count? • Depending on how you look at who has standing, things change: • Do federal dollars mean national standing? • Or, is it New York City’s turn at the federal transit pot? • New real estate development? • Where is the marginal benefit? • Jobs? • Construction? Business relocation? • Looks like redistribution of federal funds • Nearly $2 billion in sunk costs? • Planning, design and assessment are all expensive; these costs cannot be recouped if project is a “no go”
What is an appropriate discount rate? • OMB Guidelines (public investment) = 7% • “approximates marginal pre-tax rate of return on an average private investment” • U.S. Treasury bond rate (30 year) = 5.2% • New York City municipal bond rate = 6.5% • This is a long-lived project with high up-front costs—it matters Source: Guidelines and Discount Rates for Benefit-Cost Analysis of Federal Programs, OMB 1992, US Treasury Bond Rate for April 2004; NYC Municipal Bond rate based on Nuveen Bond Fund
Sensitivity Analysis: Discount Rate • Focus on transportation benefits: (in millions) (in millions) (in millions) Base case: as described above w/: (1) even distribution of capital costs over 17 years, (2) zero growth in operating costs, (3) only transportation benefits (60,000 incremental riders) Conservative case: (1) front loads construction costs, (2) zero growth in operating costs, (3) conservative rider forecasts and time savings benefits (15,000 incremental riders)
Sensitivity Analysis: Putting the Core Assumptions to the Test • Ridership assumptions/forecast • Number of incremental riders (typically 150% overestimated) • Subway shift (tight travel corridors in New York City) • Development assumptions • Incremental job creation: these remain a non-factor • Capital costs • Time distribution matters • Overruns: time and cost (will focus on project creep)
Comparing Proponents’ Research with Our Base Case Optimistic case: present value estimates Base case: present value estimates Benefits represent 60 percent of costs! Notes 50 years at 5.2 percent, dead weight loss 15% of capital construction costs
Summary: What’s going on here? • Applying discount rates uniformly: • Makes costs look better, however… • This is very expensive even relative to comparable transit projects • Standing is important; we chose to ignore economic development because: • Difficult to estimate magnitude of effect • Studies did not employ reasonable estimation techniques • Very difficult to isolate marginal effects • Given national standing, marginal effects even less likely to appear
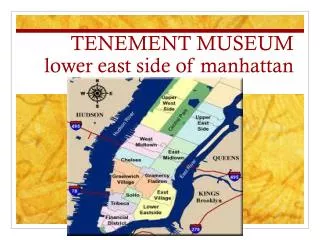
More Detailed Analysis Should Examine • Air quality improvements from mass transit • Quality of life: transportation options • Social equity: distributional weighting according to rider income distribution (Harlem, Lower East Side); access to CBDs • Value added of increased multimodal interconnection with other regional transportation • Real estate squeeze on low-income areas—a chronic problem in New York City