Download
1 / 17
170 likes | 419 Vues
South Africa’s District Health Barometer. Fiorenza Monticelli Health Systems Trust HMN meeting 28-29 Sept 2006. Background. The SA National Health Act of 2003 requires: provinces & districts develop and implement annual plans

E N D
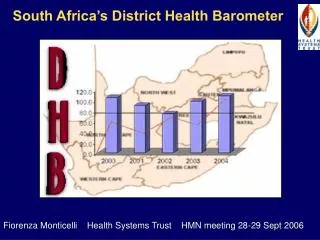
South Africa’s District Health Barometer Fiorenza Monticelli Health Systems Trust HMN meeting 28-29 Sept 2006
Background • The SA National Health Act of 2003 requires: • provinces & districts develop and implement annual plans • measure performance & monitor if achieving short term objectives year on year. • Oversupply of data coexists with large unmet needs for useful management information. • In order to meet this need HST successfully piloted a District Health Barometer in 2005, in collaboration with the National Department of Health.
Scope & Composition • Scope: A publication featuring a selection of indicators drawn from a variety of information sources which are measurable at district level on an annual basis. • Information Sources: • District Health Information System (DHIS) 90% • National TB register • Statistics South Africa – population data & basis for socioeconomic data • Treasury – Financial data (health expenditure).
Scope • Health Categories covered: • HIV/AIDS & PMTCT, TB, Maternal Health, Child Health , Human resources • Timeframe: • Jan-Dec 2004 (DHB year 1) and Financial years 03/04, 04/05, 05/06 (DHB year 2) Indicator categories
Examples of some Indicators used in the DHB • Input: • Per capita non-hospital expenditure on health (public sector) • Process: • Nurse Clinic Workload (PHC) • Output: • Immunization coverage rate & drop out rate • Nevirapine uptake rate among HIV+ pregnant women • Nevirapine uptake rate among babies born to HIV+ women • Outcome: • PHC Utilisation rate • Incidence of STI treated* • TB cure rate • Incidence of diarrhoea under 5 years (per 1000). • Impact: • Perinatal mortality rate in facility* * Year 2
Example of League Table Graph Comparing all Districts SA ave 56.7% SA target = 65% TB Cure Rate 2003 Amajuba 54.9% Sisonke 23.7%
Example of maps West Rand 80.4% Sisonke 36.4% Overberg 89.6%
Example of Maps West Rand 56%, Metsweding 54% Chris Hani 108%
Target Audience • Managers at national, provincial and district level • Strategic planning, M&E of district performance and health service delivery, resource allocation • Tool to improve quality & use of health information • Politicians • Graphic and pictorial representation giving easy understanding of issues of quality and equity • Other Sectors • e.g. Treasury, academic sector and international health community gain greater insight into the sector • Donors • To gain greater insight & identify areas of need.
Support and Use • Electronic publication received close on 1500 ‘hits’ over 8 months • Referenced in published research articles, reports and appeared in press articles • National Treasury and NDOH make available information for use + provide letters of support • NDOH have contracted HST to improve HIS data quality, data flow, timeliness and use.
Activities and outputs • Addressing Quality • Increased focus and attention on DHIS data quality, analysis, feedback and use. • HMIS, the sister project to the DHB, works in all districts to: • Improve data collection, flow and quality • Support use and interpretation of data by managers • Build capacity in HIS at all levels • Thus data irregularities identified and highlighted by the DHB, are attended to by the HMIS project on an ongoing basis.
Potential Impact • Routine service level data colleted is transformed into information that leads to action • Inequities between rural and urban areas are addressed • Improved feedback • Tool for M&E, strategic planning at province & national level • Improved transparency of performance of health sector • Continuous improvement of data quality of DHIS
Limitations and Challenges • Legal framework and access to information • Information at district level is not accessible to the public • HST apply for permission to publish data • Through the DHB, data is publicly available Fear of data going to press, creating a negative image. • Ongoing data quality issues limit choice & selection of indicators.
Future • Short to medium term: Year 2 and 3 • Ongoing feedback, improvement and support of the DHIS • Improving capacity of all managers in DOH to use & interpret data • Develop more accessible formats: available on intranets of DOH, web friendly interface with GIS • Increase dissemination (workshops/ presentations) • Build capacity at National level to take over the project • Long term: NDOH is fully involved and by year 4 manage the DHB as their own project or contract it out on an annual basis.
We acknowledge the South African National Department of Health for access to and use of their data for this publication and Atlantic Philanthropies for funding the project • The District Health Barometer can be accessed on the HST website at • http://www.hst.org.za/publications/689 • Contact details: fiorenza@hst.org.za • Thank you