AP Physics Comparability Study
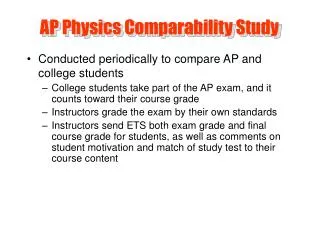
AP Physics Comparability Study. Conducted periodically to compare AP and college students College students take part of the AP exam, and it counts toward their course grade Instructors grade the exam by their own standards

AP Physics Comparability Study
E N D
Presentation Transcript
AP Physics Comparability Study • Conducted periodically to compare AP and college students • College students take part of the AP exam, and it counts toward their course grade • Instructors grade the exam by their own standards • Instructors send ETS both exam grade and final course grade for students, as well as comments on student motivation and match of study test to their course content
Comparability Study • Helps set cut points for AP grades • College students’ responses scored as AP students’ would be • ETS statisticians analyze the data, to see how college grades of A, B etc, compare to AP grades of 5, 4, etc. • AP grades are adjusted as appropriate, based on data and judgment of Chief Reader. Behind that judgment are curriculum surveys used to set course outline and exam specs, input of committee as exam questions are developed, and information about student performance from the Reading leadership. • Goal is that 4/5 cut is at college mid-A’s, 3/4 cut at mid-B’s etc.
Comparability Study • Provides some information to colleges that relates their students’ performance to the AP students and other participating colleges • College instructors receive data that allows them to compare their students as a group to the AP population and the total group of college students participating.
The Study • Evaluated both the B and C exams • Used multiple-choice sections of 2006 exams • Four study tests • Questions in B divided roughly in half • Since B exam covers the whole survey course, questions divided into “typical” semesters --- mechanics, fluids, thermal E&M, waves & optics, atomic & nuclear • C Mechanics and C E&M already separate exams, and were given in their entirety
The Study • Invitations sent to colleges and universities receiving 20 or more AP Physics B 2006 exam grades • Letter sent to department chairs, college AP Physics Readers and present/past Development Committee members • Instructors gave tests at appropriate time near the end of their semester courses
The Participants • Not all colleges gave every study test • Physics B first semester had 11 colleges, Physics B second semester had 4 (all these also gave first semester) Physics C Mechanics and E&M each had 8 • Desire 20 colleges minimum – since study was added late in summer, many colleges couldn’t work it into their schedules
The Analysis • 2007 exam analysis done as usual, using standard equating performed each year, yielding cut scores based on carryover of same score scale • Data from colleges analyzed – through method similar to regular equating, a set of “new” cut scores for 2006 generated based on college standards
The Analysis • Chief Reader, ETS staff, and CB staff review individual college data to identify any “suspect” data, e.g. • Students not motivated • Test content not good match to course content • Low correlation between student course grade and study test grade • Again using equating, equivalent adjusted cut scores for 2007 exams are generated
Physics BNumber correct on 2006 Multiple-choice (68 questions) The Data • Did not have data on both parts for many students. College scores on semester tests converted to scores on complete exam, taking into account difference in difficulty of the two parts. • 2006 AP students getting 5 or 4 score higher than college average.
Physics BCut points for 2007 exam (180 points total) • Cut scores suggested by study lower than present standards – but not prudent to make large adjustments based on the small number of colleges participating. • Large differences warrant a larger study that also includes free-response questions.
Physics C: MechanicsNumber correct on 2006 Multiple-choice (35 questions) • College and AP student performance fairly similar
Physics C: MechanicsCut points for 2007 exam (90 points total) • Since the sample of colleges is small there is no compelling reason to adjust cut points
Physics C: Electricity & MagnetismNumber correct on 2006 Multiple-choice (35 questions) • Again, college and AP student performance fairly similar
Physics C: Electricity & MagnetismCut points for 2007 exam (90 points total) • Greater discrepancies at 5/4 and 3/2 cuts than for Mechanics • Small sample of colleges warrants caution, so 5/4 cut was adjusted up only slightly • Less prudent to ease standards based on small sample, so 3/2 cut not adjusted
Conclusions • Physics B standards might be high compared to colleges, but further evidence is needed before making major adjustments. • No evidence that Physics C standards have been far from college standards. • A larger study on all exams is needed to further confirm results – likely to be conducted when redesign is implemented