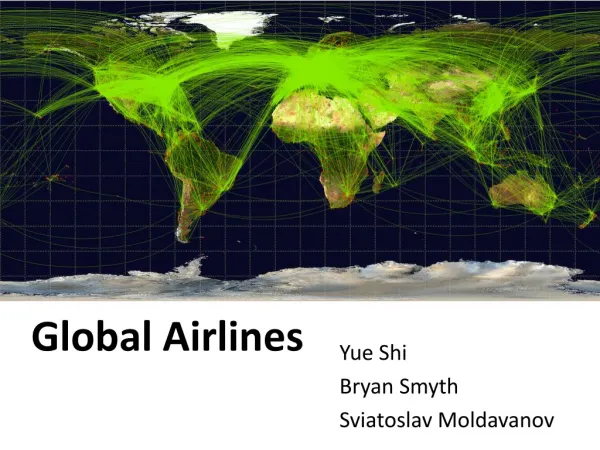
Global Airlines
Explore the current state of the airline industry, key statistics, regional overviews of Europe, North America & Asia-Pacific, and insights on major carriers like British Airways, Singapore Airlines, and SouthWest. Analyze industry characteristics, profitability, macroeconomic forces, trends, and future outlook factors like recovery, fuel prices, subsidies, regulations, and customer demands.

Global Airlines
E N D
Presentation Transcript
Global Airlines Presented By: Parveen Rai Dan Wurst Amar Leekha Aman Sandhu
Overview of Presentation • Industry Overview • Current State • Trends • Key Statistics • Regional Overviews • Europe, North America & Asia-Pacific • British Airways • Singapore Airlines • SouthWest • Conclusion
Characteristics of the Industry • Very cyclical, moves with strength of economy • Low Profit Margins….and falling • Economic growth • Asset intensive industry • Investments in aircraft, facilities & equipment • Labour constitutes largest cost • Jet fuel costs second largest expense • Strategic Alliances to defend against competition • Technology • E-tickets • Online Vendors
Future Outlook • Recovery of US economy • Confidence in President Bush • Fuel Prices? • Government Funding • National security • Subsidies • High tax burden & Regulations • Cost structure • Increase buying power of customers • Customer demands • Personal & Business customers
Macroeconomic Forces • Slow Economy • Airlines lost $2.5 billion in 2003 (IATA) • Total 2001-2003 losses: $23.2 billion • External Factors Leading to Losses: • September 11th • Costs of implementing new security measures at airports • Severe Acute Respiratory Syndrome (SARS) • Increased insurance premiums • Rising fuel prices in 2003
Trends • Growth in Traffic • RPM’s grew 2.3% in 2003 • Average industry load factor reached record 73.4 % • Increase in cargo volume • Large Layoffs • Increased competition from low-cost carriers • Westjet, Southwest and other clone airlines • Increased borrowing to cover losses from macroeconomic effects
European Market • Slower growth for major European carriers: • Increase of “no frill” carriers • Deregulation • Worldwide Economic downturn • Structural problems of overcapacity • Threats of terrorism* ***Carriers exposed to US market***
Trends: Euro Market • No-frills airlines growing rapidly • Traffic levels within Europe have remained strong • Account for 1/3 of UK domestic services and routes between the UK and Europe • Increase in amount of planes & routes • Deregulations reduce barriers to entry • Likely to be followed by industry consolidation • Further Growth expected • Future focus on other Euro hubs • Alliances and Strategic Partnerships
North American Market • Most mature market • 1978 Deregulation: emergence of “no-frills” market • Followed by consolidation of industry • “No-frills” make up 20% of US domestic market • Southwest leading low-cost carrier • Sending major carriers into bankruptcy
North America (cont) • Major Domestic Airlines expanding international presence • US signing of “open skies” agreement • Unrestricted capacity and frequency • Factors depressing air travel • September 11 • 2001 Recession • Fall of US Airways & United: currently restructuring
Asia-Pacific Market • Relatively immature airline market • Strong growth in airline travel • 1997-98 Asian crisis temporarily halted growth • Restructuring • Disposal of non core assets • Termination of loss making routes • Wide ranging cost reduction programs
Asia-Pacific • Asian carriers look to form alliances with European and N. American carriers • Affected by US economy downturn (2001-2002) • Less sever on air travel industry compared to US • Growth rate expected to be greater than that of western airline markets • Rapid growth in large domestic markets (China) • Most regulated region for air travel • Competitive Advantage: closer to home
Profitable Strategies • Recovery of airline industry helps other industries • Carriers must demonstrate: • “Comfortable” Security • Customer service • Productivity • Government Involvement: • Cooperation with airports and airlines • Encourage travel • Minimize hassles • Airport fees • Alternatives for short Hauls
Profitable Strategies • Airport – Airline Relationship • Work together with final customer in mind • Ticket Prices • Low cost carriers • Increased competition • Price conscious business customers • Labour Productivity • Consolidation of Industry • Mergers/Strategic Alliances
Growth Constraints: Fuel Costs • Fuel Efficiency: 43.6 pm/gallon • Hedging
Growth Constraints: Taxes • Taxes: • 1972: Taxes = 7% of ticket price • 2004: 26% of ticket
British Airlines • Listed and Traded on the London Stock Exchange • Trading symbol: BAY • Also Trades as an ADR on the TSX and NYSE • Symbol: BAB • 1 ADR = 10 Shares
British Airlines • As of Market Close on November 2, 2004 • Bid: 218.75 Pents ($4.93 CDN) • Ask:219 Pents ($4.94 CDN) • Volume 28,551,043 • Outstanding Shares: 1,070,077,000
Background • One of the leading airlines in Europe • Second biggest in Europe by passengers carried • Operating Bases • Heathrow • Gatwick • British Airways is a public limited company • Employed approximately 49,072 employees in 2004 • It operates 291 aircraft • Flies to 550 destinations in 133 countries
A Quick History Lesson • Successors: • Aircraft Transport and Travel Limited (Daimler Airways) • Instone • Handley Page • British Air Marine Navigation • Smaller Airlines (1935 merged into British Airways Limited) • Merged In 1939 • British Overseas Airways Corporation • Trading of BA shares began in 1987
Alliance • Member of Oneworld • American airlines • Qantas • Cathay Pacific • Iberia • Finair • Aer Lingus • LanChile
Franchises and Holdings • Franchises • GB airlines • British Mediterranean • British Airlines Citiexpress • Loganair • Sun Air • Holdings • Air Mauritius • Qantas • Spanish Iberia
Stated Objectives • Future size and shape strategy • Achieve a 10% operating margin • Operating margin up 1.6 points from 3.8 points in 2003 • 13,000 reduction in employees since August, 2001 • Fleet and network strategy • Aircraft replacements • Reduced fleet by 39 aircraft • Gatwick moving to point and spoke strategy • Low fares strategy • On 180 shorthaul routes • Compete with no frill competitors • External cost reductions • Hedging strategies • Employee cost saving strategies • Product and service improvements
Main Competitors • Europe Market • Lufthansa • Air France • North American Market • United
Strengths/Opportunities • Strong Brand Equity • Account for over half of flights within UK • New low fares strategy to compete against “no frills airlines” • 37.3% increase in operating profit • Increasing air travel
Weaknesses and Threats • Heavy Competition • Strict Government Regulations • Route flying rights • Fare setting • Airport access • “Slots” availability • New operational standards (security, safety) • Jet Fuel Prices • Terrorism • Demand for travel affected by economic conditions (SARS) • Increased Insurance Costs • Increased Security Costs
Management • Rod Eddinghton • Chief Executive • May 2000 • John Rishton • CFO • September 1994 via controller • Mike Street • Director of customer service and operations • 1997 • Robert Webb QC • General Counsel • 1998 • Martin George • Director Marketing and Communications • 1987 via director of Marketing