Download

1 / 26
260 likes | 631 Vues
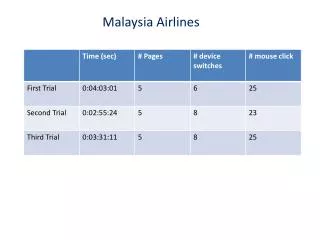
www.airlines.org dswierenga@airlines.org. NET INCOME. U.S. Scheduled Airlines. $ Billions. 5. 4. 3. 2. 1. 0. -1. EXPECTED. -2. -3. -4. 9/11 IMPACT. -5. -6. -7. -8. 80. 81. 82. 83. 84. 85. 86. 87. 88. 89. 90. 91. 92. 93. 94. 95. 96. 97. 98. 99. 00. 01.

E N D
NET INCOME U.S. Scheduled Airlines $ Billions 5 4 3 2 1 0 -1 EXPECTED -2 -3 -4 9/11 IMPACT -5 -6 -7 -8 80 81 82 83 84 85 86 87 88 89 90 91 92 93 94 95 96 97 98 99 00 01
TRAFFIC GROWTH Percent Change in Revenue Passenger Miles 15 International Domestic 10 5 0 Y2K - 6.5 Million Passengers -5 J 1999 F M A M J J A S O N J 2000 D F M A M J J A S O N J 2001 D F M A M J J A S O N D
TRAFFIC GROWTH Percent Change in Revenue Passenger Miles International 10 0 Domestic -10 -20 -30 -40 Jan 1999 F M A M J J A S O Jan 2000 N D F M A M J J A S O Jan 2001 N D F M A M J J A S O Jan 2002 N D F M A
BLOCK HOURS PER DAY PER AIRCRAFT Passenger Service 10.5 10.0 9.5 9.0 8.5 - 15% 8.0 91 1 92 1 93 1 94 1 95 1 96 1 97 1 98 1 99 1 00 1 01 1
Jet Airplanes vs. Capacity (ASMs) U.S. Airlines AIRPLANES ASMs Thousands 7,000 1000 6,500 950 6,000 900 5,500 850 5,000 800 4,500 750 Aircraft 4,000 700 ASMs 1991 1992 1993 1994 1995 1996 1997 1998 1999 2000 2001 Source: World Jet Inventory
AIRCRAFT ORDERS AND OPTIONS ATA U.S. Members 1,937 2,748 Options Firm Orders Dec 90 Jun 91 Dec 91 Jun 92 Dec 92 Jun 93 Dec 93 Jun 94 Dec 94 Jun 95 Dec 95 Jun 96 Dec 96 Jun 97 Dec 97 Jun 98 Dec 98 Jun 99 Dec 99 Jun 00 Dec 00 Jun 01 Dec 01
EXPECTED DELIVERY DATES ATA Members Options Firm Orders 2000 2001 2002 2003 2004 2005 2006 2007 2008
U.S. AIRLINE 2001 JET FLEET By Year of Delivery to Original Owner 700 6,507 Aircraft 600 500 400 300 200 100 5,538 Aircraft (excl Regional Jets) 0 <65 1968 1972 1976 1980 1984 1988 1992 1996 2000 1966 1970 1974 1978 1982 1986 1990 1994 1998 Source: Jet Information Services
AVERAGE AGE OF FLEET 15.0 14.5 14.0 13.5 13.0 12.5 12.0 1990 91 92 93 94 95 96 97 98 99 00 01 Source: The Airline Monitor
FUEL PRODUCTIVITY Passenger Miles per Gallon 45 40 35 30 25 20 15 10 70 72 74 76 78 80 82 84 86 88 90 92 94 96 98 00 71 73 75 77 79 81 83 85 87 89 91 93 95 97 99 01
JET FUEL PRICE TRENDS Excludes taxes Cents per Gallon $ per Barrel 105 35 90 30 JET FUEL (Left Scale) 75 25 60 20 Forecast WTI 45 15 (Right Scale) 30 10 Jan 1996 Jan 1997 Oct Jul Jan 1998 Jul Jan 1999 Jul Jan 2000 Jul Jan 2001 Jul Jan 2002 Jul Apr Jul Apr Oct Apr Oct Apr Oct Apr Oct Apr Oct Apr Oct
LABOR COSTS PER EMPLOYEE Wages and Benefits 75.5 $ Thousands 75 71.9 1986-2001 Compensation Annual Growth Rate +3.6% CPI Annual Growth Rate +3.2% 68.6 70 64.8 65 60 55 50 $42.4 45 40 35 1982 1984 1986 1988 1990 1992 1994 1996 1998 2000 2002e 1983 1985 1987 1989 1991 1993 1995 1997 1999 2001
PRICE TRENDS System Revenue per Passenger Mile Cents 1,4.0 2002 2001 1,3.5 2000 2000 1,3.0 1,2.5 $5 Bill. 1,2.0 2001 1,1.5 2002 2001 - 7.6% 2000 + 4.4% 1999 - 1.3% 1,1.0 1,0.5 Jan Feb Mar Apr May Jun Jul Aug Sep Oct Nov Dec
REVENUE TRENDS Business vs. Personal/PleasurePreliminary Data Percent 10 0 -10 -20 -30 -40 -50 Business Personal -60 J F M A M J J A S O N D J F 2002 2001
BUSINESS VS. PERSONAL / PLEASURE 2001 Revenue & Traffic Shares2001 Business Revenue Traffic Preliminary Data
CURRENT TRAFFIC TRENDS COMPARED TO GULF WAR Percent Change 20 Gulf War Intl 10 FEB 91 0 Gulf War System -10 -20 -30 SEP 01 -40 2001 1990/91 System 1990/91 International
TRAFFIC GROWTH COMPARED TO GDP And Forecast for 2001 and 2002 GDP Percent Traffic Percent 5 10 0 0 -5 -10 -10 -20 -15 -30 1993 1 1994 1 1995 1 1996 1 1997 1 1998 1 1999 1 2000 1 2001 1 2002 1
NET PROFIT MARGIN U.S. INDUSTRY VS. AIRLINES Percent U.S. INDUSTRY 5 AIRLINES 0 -5 80 81 82 83 84 85 86 87 88 89 90 91 92 93 94 95 96 97 98 99 00 01 02e
CASH FLOW Four Quarter Moving Total Majors and Nationals $ Billions 14 12 10 FORECAST 8 6 4 2 0 -2 80/4 81/1 81/2 81/3 81/4 82/1 82/2 82/3 82/4 83/1 83/2 83/3 83/4 84/1 84/2 84/3 84/4 85/1 85/2 85/3 85/4 86/1 86/2 86/3 86/4 87/1 87/2 87/3 87/4 88/1 88/2 88/3 88/4 89/1 89/2 89/3 89/4 90/1 90/2 90/3 90/4 91/1 91/2 91/3 91/4 92/1 92/2 92/3 92/4 93/1 93/2 93/3 93/4 94/1 94/2 94/3 94/4 95/1 95/2 95/3 95/4 96/1 96/2 96/3 96/4 97/1 97/2 97/3 97/4 98/1 98/2 98/3 98/4 99/1 99/2 99/3 99/4 00/1 00/2 00/3 00/4 01/1 01/2 01/3 01/4 02/1 02/2 02/3 02/4
AIRLINE BALANCE SHEETS Debt as a Percent of Total Capital Percent 70 AIRLINES 60 50 U.S. INDUSTRY 40 30 20 1980 1982 1984 1986 1988 1990 1992 1994 1996 1998 2000 2002e 1981 1983 1985 1987 1989 1991 1993 1995 1997 1999 2001p