Weaker Solar Wind Over the Protracted Solar Minimum
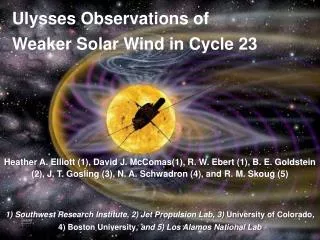
Weaker Solar Wind Over the Protracted Solar Minimum. Dave McComas Southwest Research Institute San Antonio, TX With input from and thanks to Heather Elliott, Nathan Schwadron, and Ruedi von Steiger. Ulysses’ Three Polar Orbits.

Weaker Solar Wind Over the Protracted Solar Minimum
E N D
Presentation Transcript
Weaker Solar WindOver the ProtractedSolar Minimum Dave McComas Southwest Research Institute San Antonio, TX With input from and thanks to Heather Elliott, Nathan Schwadron, and Ruedi von Steiger
Comparison of SWOOPS SW plasma data from Ulysses’ 1st and 3rd (Solar Minimum) Orbits McComas et al., GRL, 2008
SWOOPS first and third orbits (> 40°) • Parameter <1st> <3rd><3rd>-<1st> • <1st> • vp (km s-1) 761 739 -3% • vα (km s-1) 772 746 -3% • npR2 (cm-3) 2.65 2.19 -17% • nαR2 (cm-3) 0.12 0.10 -17% • TpR x105 (K) 2.66 2.30 -14% • Mass Flux (kg m-2 s-1) • ρiviR2 x10-15 3.96 3.17 -20% • Dynamic Pressure (nPa) • ρivi2R2 3.01 2.34 -22% • Proton Thermal Pressure (pPa) • npkTpR3 9.89 7.43 -25% • Alpha to proton ratio, nα/np 0.044 0.044 ----- • Long term reduction in pressure inflating Heliosphere McComas et al., GRL, 2008
Heating in Subsonic Region • Nearly all of the energy of the solar wind is carried off in the form of bulk flow energy excellent measure of the average energy being introduced in the corona, which ultimately accelerates the solar wind • Leer and Holzer [1980] developed a simple model to examine the effects of solar wind energization by heating and momentum addition • addition of energy above the sonic point primarily increases the wind speed • addition of energy below the sonic point increases the mass and momentum flux roughly comparably, leading to little change in wind speed higher density McComas et al., GRL, 2008
Ulysses (black) compared to ACE (red)Shows that reduction in SW power is truly global phenomenon McComas et al., GRL, 2008
Electron Properties • Electron density and temperature deduced using quasi-thermal noise spectroscopy • Compared 3rd orbit PCH data with 1st orbit ~19% less dense (confirms SWOOPS ~17% lower protons and alphas) ~13% lower electron temperature (similar to SWOOPS ~14% lower proton temperature) Issautier et al., GRL, 2008
IMF 1st vs 3rd Orbits (Ulysses) Smith and Balogh, GRL, 2008
IMF Observations • Earth-based magnetograph observations indicated that the Sun’s polar cap field strength, Bp, decreased by a factor of about two between 1st and 3rd polar passes • Ulysses measurements show that the average value of r**2 Br decreased from • 3.6 nT (AU)**2 in 1993.5 to 1995.0 • 2.3 nT (AU)**2 in 2006.1 to 2007.4 • Decreased by factor of 0.64, but not precisely at minimum • Averages of in-ecliptic Br at the two solar minima are 2.82 and 2.45 nT (13% reduction) • Decreases contrary to observation based on previous solar cycles that Br returns to the same value of ~3 nT at solar minima Smith and Balogh, GRL, 2008
Magnetic Field Fluctuations Decreased Smith and Balogh, GRL, 2008
THE SOLAR WIND POWER FROM MAGNETIC FLUX • Reduction in high latitude fast SW power in Ulysses 3rd orbit compared to 1st correlates with reduction in Sun’s total open magnetic flux • These observations support models of the SW energy and particle sources (Schwadron & McComas, 2003; Schwadron et al., 2006) • Constant electromagnetic energy input per particle (assumed) • Magnetic flux emergence naturally leads to an energy flux proportional to the strength of large-scale magnetic field Schwadron and McComas, ApJ, 2008
Solar wind mass flux vs.magnetic flux density Sun delivers ∼600 kW/Wb to power the solar windThis power to magnetic flux relation extremely stable over Ulysses’ three polar orbits Schwadron and McComas, ApJ, 2008
SW Power inAstrophysical context SW observation in context of X-ray results of Pevtsov et al., 2003Black line is 600 kW / Wb as shown in previous plotRed line shows the power X-ray luminosity of ~1% of total SW power (Schwadron et al. 2006) Schwadron and McComas, ApJ, 2008
So what has happened in the solar wind since 2007(2008 publications) ???
Summary • Ulysses’ 3rd orbit showed fast SW was slightly slower, significantly less dense, cooler, had less m, p, and E flux and weaker IMF than previous solar minimum (first) orbit • Combined ACE/Ulysses show that this is a significant, long-term change in SW output from the entire Sun • Similar SW speeds with lower power indicates SW energy fed in below the sonic point • Charge states indicate coronal temperatures lower • Significant, long-term trend to lower dynamic pressure Heliosphere has been shrinking (Voyager & IBEX) • Same law that governs energy released in the corona and from other stars also applies to the total energy in the solar wind • Decreasing SW power has continued through 2009 approaching ~1.5 compared to ~3 pPa 20 years ago