Download
1 / 18
190 likes | 1.27k Vues
Absolute Value Functions and Graphs. Objective: G raph an absolute value function by performing transformations on the parent function f ( x ) = | x |. Vocabulary. The function f(x) = |x| is an absolute value function .

E N D
Absolute Value Functions and Graphs Objective: Graph an absolute value function by performing transformations on the parent function f (x) = |x|.
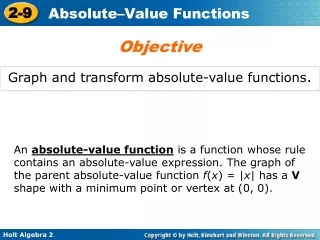
Vocabulary • The function f(x) = |x| is an absolute value function. • The highest of lowest point on the graph of an absolute value function is called the vertex. • An axis of symmetry of the graph of a function is a vertical line that divides the graph into mirror images. • An absolute value graph has one axis of symmetry that passes through the vertex.
Absolute Value Function • Absolute Value Function • Vertex • Axis of Symmetry
Building the Absolute Value Function The absolute value function is defined by f (x) = |x|. This is the absolute value parent function.
Parent Function • V-shape • It is symmetric about the y-axis (Axis of Symmetry) • The vertexis the minimum point on the graph
Translation A translation is a transformation that shifts a graph horizontally or vertically, but doesn’t change the overall shape or orientation.
Translation The graph of y = |x – h| + k is the graph of y = |x| translated h horizontal units and y vertical units. • The new vertex is at (h, k)
Stretching and Compression The graph of y = a|x| is graph of y = |x| vertically stretched or compressed depending on the |a|. The value of a acts like the slope.
Reflection The graph of y = a|x| is graph of y = |x| reflected across the x-axis.
Transformations y = -a |x – h| + k *Remember that (h, k) is your vertex* Vertical Translation (up/down) Reflection across the x-axis Vertical Stretcha > 1(makes it narrower)ORVertical Compression 0 < a < 1 (makes it wider) Horizontal Translation Moves left/right (opposite of h)
Multiple Transformations In general, the graph of an absolute value function of the form y = a|x – h| + kcan involve translations, reflections, stretches or compressions. To graph an absolute value function, start by identifying the vertex.
Graphing Absolute Value Functions Graphing y = a|x – h| + k is straight forward: • Plot the vertex (h, k). (note…if +h inside that means h is negative(to the left); if – h inside that means h is positive (to the right) • Use the a value as slope to plot more points. Remember you have to do positive and negative slope to get points on both sides of the V • Connect the dots in a V-shape.
Example 1 Graph the following functions without making a table. y = |x – 2| + 3This graph will go right 2 and up 3 so from the origin go right 2 and up 3. This is the vertex (2, 3). Now from that point use the positive and negative slope (a = 1 here) to get more points.
Your turn: Graph the following functions without making a table. Text book page 111 #14 y = |x - 1| + 3 Identify the vertex Vertex ( , ) Slope =
Example 2 Graph the following functions without making a table. y = (1/2)|x| This function does not have an “h” or “k” so the vertex is (0, 0). Since a = ½ the slope is ½. Go up 1 and right 2 then up one and left 2.
Example 3 Graph the following functions without making a table. f(x) = -3|x + 1| – 2 This graph will go left 1 and down two so the vertex will be (-1, -2). Since “a” is negative the graph will open down. Since the value of “a” is 3 the slope will be 3 and -3 (just remember to go down.)
Your turn: Graph the following functions without making a table. Text book page 112 #42 y = 2|x + 2| - 3 Identify the vertex Vertex ( , ) Slope =