Introduction to Bioinformatics 6 . Statistical Analysis of Gene Expression Matrices II
190 likes | 623 Vues
Introduction to Bioinformatics 6 . Statistical Analysis of Gene Expression Matrices II. Course 341 Department of Computing Imperial College, London Moustafa Ghanem. Lecture Overview. Motivation Get a feel for t-values and how they change Volcano plots

Introduction to Bioinformatics 6 . Statistical Analysis of Gene Expression Matrices II
E N D
Presentation Transcript
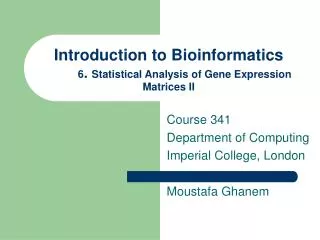
Introduction to Bioinformatics6. Statistical Analysis of Gene Expression Matrices II Course 341 Department of Computing Imperial College, London Moustafa Ghanem
Lecture Overview • Motivation • Get a feel for t-values and how they change • Volcano plots • Visual method for differential gene expression analysis • Meaning of x and y axes • Interpretation of results
Interpretation of t-test • The higher the t-value, the lower the p-value, the more confident you are
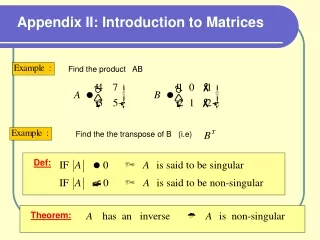
Where d is calculated by Remember these formulae !! Calculating t-test (t statistic) • First calculate t statistic value and then calculate p value For the paired t-test, t is calculated using the following formula: And n is the number of pairs being tested. • For an unpaired (independent group) t-test, the following formula is used: Where σ(x) is the standard deviation of x andn (x) is the number of elements in x.
Calculating and Interpreting t-values Consider the following examples, and assume a paired experiment:
High t-value • Take Gene A, assuming paired test: • For Either type of test • Average Difference is = 100, SD. = 0 • t value is near infinity, • p is extremely low
Where d is calculated by Consider Gene M for a paired experiment • Average Difference is = 0 • t value is zero, what does this mean?
Where d is calculated by Consider Gene T for a paired experiment
t = Mean of differences Value S.D. of differences/sqrt(n) d4 d3 d1 d2 d =Diff Sample ID davg d =Diff davg Sample ID Sample ID Graphical Interpretation of t-test (Paired) • t-value = Signal/Noise ratio Value d4 d3 d2 Sample ID Case1: Low Variation around mean of differences Case2: Moderate Variation around mean of differences
Value d4 d3 d1 d2 d =Diff Sample ID davg Sample ID Graphical Interpretation of t-test (Paired) Case3: Large Variation around mean of differences
Back to our problem 4 Wild KO samples (Red) Columns represent samples 4 Wild Type samples (Blue) 5000 Rows represent genes
Hypothesis Testing • Uses hypothesis testing methodology. • For each Gene (>5,000) • Pose Null Hypothesis (Ho) that gene is not affected • Pose Alternative Hypothesis (Ha) that gene is affected • Use statistical techniques to calculate the probability of rejecting the hypothesis (p-value) • If p-value < some critical value reject Ho and Accept Ha • The issues: • Large number of genes (or experiments) • Need quick way to filter out significant genes that have high fold change • Need also to sort genes by fold change and significance
For each gene compare the value of the effect between population WT vs. KO (fold change) For each gene calculate the significance of the change (t-test, p-value) Identify Genes with high effect and high significance Volcano Plot Volcano Plots Volcano plots are a graphical means for visualising results of large numbers of t-tests allowing us to plot both the Effect and significance of each test in an easy to interpret way
Effect = log(WT) – log(KO) 2 2 = log(WT / KO) 2 Volcano plots • In a volcano plot: • X-axis represents effect measured as fold change: If WT = WO, Effect Fold Change = 0 , If WT = 2 WO, Effect Fold Change = 1 ...
Numerical Interpretation (Effect) Effect has doubled 21 (2 raised to the power of 1) Two Fold Change Effect has halved 20.5 (2 raised to the power of 0.5) Using log2 for X axis:
Volcano plots • In a volcano plot: • y-axis represents the number of zeroes in the p-value • (remember with a p-value of 0.0001, you are more confident than with a p-value of 0.01 • This is just a trick so that higher values on the graph are more important Calculate Significance as – log (p_value) 10 If p = 0.1, -log(0.1) = 1 (1 decimal point) If p = 0.01, -log (0.01) = 2 (2 decimal points) ...
Numerical Interpretation (Significance) p< 0.01 (2 decimal places) p< 0.1 (1 decimal place) Using log10 for Y axis:
Choosing log scales is a matter of convenience Effect can be both +ve or -ve Visualise the Result :Volcano Plot High Significance • Effect vs. Significance • Selections of items that have both a large effect and are highly significant can be identified easily. High Effect & Significance Boring stuff Low Significance -ve effect +ve effect
Summary • t-Test good for small samples (in our case 4 paired observations) • t distribution approximates to normal distribution when degrees of freedom > 30 • Remember formulae for paired/un-paired • Volcano plot simple method for visualising large sets of such observations • Remember formula for x-axis • Remember formula for y-axi