Definitions of Poverty
120 likes | 1.04k Vues
Definitions of Poverty Absolute Standard Cost of Food Budget Times 3 $19,971 for a Family of Four $10,160 for a Single Person Median Income = $46,326 (2005) 2005: 37 million people (12.6%) Relative Standard (European Union) 50% of the Median Income World Bank

Definitions of Poverty
E N D
Presentation Transcript
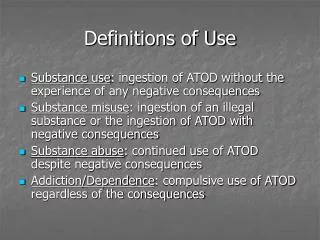
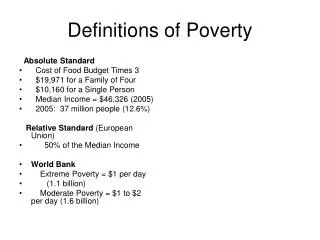
Definitions of Poverty Absolute Standard • Cost of Food Budget Times 3 • $19,971 for a Family of Four • $10,160 for a Single Person • Median Income = $46,326 (2005) • 2005: 37 million people (12.6%) Relative Standard (European Union) • 50% of the Median Income • World Bank • Extreme Poverty = $1 per day • (1.1 billion) • Moderate Poverty = $1 to $2 per day (1.6 billion)
Poverty Thresholds for 2005 • One Person Under 65 $10,160 • One Adult, One Child $13,461 • Two Adults, No Children $13,078 • One Adult, Two Children $15,735 • Two Adults, Two Children $19,806 • Two Adults Three Children $23,307 • Nine People $40,288
Definitions of Poverty Absolute Standard • Cost of Food Budget Times 3 • $19,971 for a Family of Four • $10,160 for a Single Person • Median Income = $46,326 (2005) • 2005: 37 million people (12.6%) Relative Standard (European Union) • 50% of the Median Income • World Bank • Extreme Poverty = $1 per day • (1.1 billion) • Moderate Poverty = $1 to $2 per day (1.6 billion)
Poverty Rates Over Time • Absolute Standard Relative Standard • 1949 39% 25% • 1969 12.1% 21% • 1979 11.7% • 1989 12.8 • 1995 13.8 • 1999 11.3 26% • 2001 11.7 • 2002 12.1 • 2003 12.5 • 2004 12.7 • 2005 12.6
Poverty Rates • Absolute(2004) Relative(2000) • All People 12.6% 21.1% • Ethnicity • White 10.8% 15.7% • Black 24.6% 35.5% • Asian 9.9% 18.9% • Hispanic 21.8% 37.0% • Native American 25.9% NA • Age • Under 18 17.4% • 18 to 64 11.2% • 65 and up 10.5% • Family Type • Married Couple 5.6% 12.7% • Married With Children 6.9% 14.2% • Female Headed with Children 35.3% 52.6% • Unrelated 18.9% 34.1% • Education (Age 25+) • Less than High School 22.2% 42.6% • High School 9.2% 19.7% • Some College 5.9% 13.4% • College Graduate 3.2% 6.4% • Citizenship • Native 12.0% 20.2% • Naturalized Citizen 10.2% 19.7% • Not a Citizen 21.6% 34.4%
International Comparisons • 50% of the Median Income • Total Population Children • Australia (1994) 14.3% 15.8% • Austria (2000) 7.7% 7.8% • Belgium (2000) 8.0% 6.7% • Canada (2000) 11.4% 14.9% • Denmark (1992) 7.2% 5.0% • Finland (2000) 5.4% 2.8% • France (1994) 8.0% 7.9% • Germany (2000) 8.3% 9.0% • Italy (2000) 12.7% 16.6% • Mexico (2002) 20.2% 24.8% • Netherlands (1999) 7.3% 9.8% • Spain (2000) 14.3% 16.1% • Sweden (2000) 6.5% 4.2% • Switzerland (2002) 7.6% 6.7% • Taiwan (2000) 9.1% 8.0% • United Kingdom (1999) 12.4% 15.3% • United States (2000) 17.0% 21.9%
Distribution of Income • Percent of Income • 2003 1967 • Lowest Quintile 3.4% 4.0% • Second Quintile 8.7% 10.8% • Third Quintile 14.8% 17.3% • Fourth Quintile 23.4% 24.2% • Top Quintile 49.8% 43.8% • Top 5% 22.4% 17.5%
Distribution of Wealth • 2001 1983 • Bottom 40% 0.3% 0.9% • 3rd 20% 3.9% 5.2% • 4th 20% 11.3% 12.3% • Top 20% 84.4% 81.3% • Top 5% 59.2% • Top 1% 33.4%
Aid to Families with Dependent Children (AFDC) • 1. Recipients • a. Single mothers with children • b. In California, also two-parent families if the main • earner is unemployed • c. Income is below a certain amount • 2. Benefits for a mother with 2 children and no other • income • a. 1996: $565 per month • b. 2001: $645 per month • c. Declined $0.30 for every dollar earned working • d. Also eligible for Food Stamps and Medicaid and possibly Rent • Supplements • 3. Numbers as of 1996 • a. 2.6 million people in California; 12.9 million people nationally • b. Perhaps ¼ of recipients collected for 10 years or more • 4. Perverse Incentives • a. Incentive not to work • b. Incentive for fathers not to pay child support • c. Incentive for single mothers to live separately from their own parents • d. Incentive for more out-of-wedlock births
Personal Responsibility and Work Opportunity Act of 1996 • 1. New Name: Temporary Assistance for Needy Families – TANF (Cal Works) • 2. The recipient can collect benefits for no more than two years. • The two years is to be used to get ready for employment. • The recipient can collect benefits for no more than five years in a lifetime. • 3. Characteristics of Recipients • 40% had failed to finish high school • 75% were in the bottom 25% on aptitude tests • 4. Numbers receiving assistance fell from 1996 to 2001 • a. Americans: from 12.9 million to 5.3 million • b. Californians: from 2.6 million to 1.2 million • c. Percent of Americans fell from 4.5% to 1.9% • 5. Gain from working rather than being on welfare: • $2,000 per year in 1986 and $7,100 per year in 1997 • 6. Employment Rates of Single Mothers: • 60% in 1994 72% in 1999