Download
1 / 35
350 likes | 576 Vues
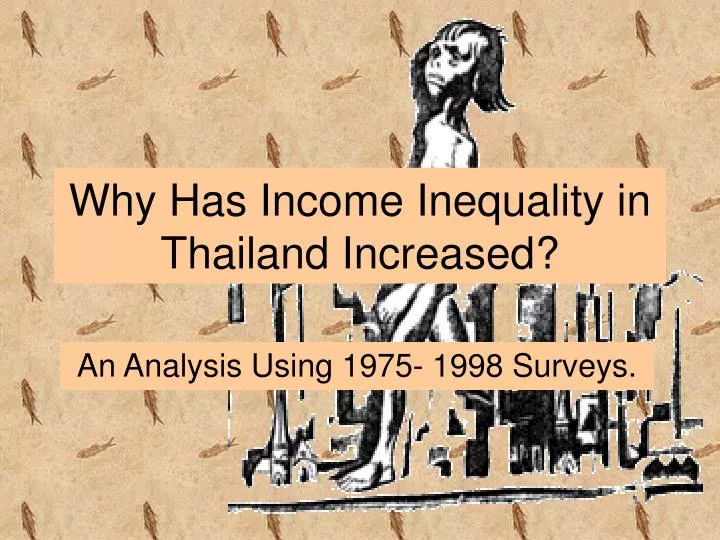
Why Has Income Inequality in Thailand Increased?. An Analysis Using 1975- 1998 Surveys. . What is Income Inequality?. Income inequality measures the distribution of income among members of a society. Income inequality in Thailand. The effects of agricultural factors Financial development

E N D
Why Has Income Inequality in Thailand Increased? An Analysis Using 1975- 1998 Surveys.
What is Income Inequality? Income inequality measures the distribution of income among members of a society.
Income inequality in Thailand • The effects of agricultural factors • Financial development • Education level • Poverty Incidence * Play an important role in explaining Thailand’s Inequality changes.
Per Capita GNP (1975 -1998) Thailand has reached the more developed country status $625 --> $1831
Changes in Income Distribution Income inequality in Thailand has increased significantly in these 24 years.
Agricultural Sector • While the share of agricultural sector in total GDP decreased (27% to 12% from 1974 to 1998), the labor force still accounted for 51% of total labor force. • Income levels in this sector is lower than other sectors. • Farm prices and harvest affect the value of agricultural output.
Poverty Incidence • While poverty has decreased due to its economic growth, the inequality increase can still be problematic from the perspective of fairness. • Inequality has a negative effect on poverty both directly and through low growth rates.
Decomposability of Inequality Indices • The average household income in BANGKOK is 2.6 times larger than the rural area (northeastern Region) in 1975-1976, and 3.4 times in 1998. • The interregional inequality is the driving force behind the inequality of the whole country.
Gini Index • It is impossible, however, to decompose the Gini Index, which is the most popular among many inequality indices. • Mean Logarithmic Deviation (MLD): as a decomposable inequality index in addition to the Gini Index.
Changes in Income Inequality Decomposability of Inequality Indices The Gini index is denoted by the following equation : This can be expressed geometrically using the Lorenz Curve by decomposed it into three parts.
Lambert and Aronson decomposed the Gini index into 3 parts : Gini Index of whole country when income distribution are perfectly equalized. N and Ni are population of the whole country. Population weighted average of Gini Indices Mixture of between group and within group inequality and not decomposable. Between Group Within Group
Bourguignon and Shorrocks proposed a decomposable inequality index which is defined axiomatically. (base on axiom) • Let us set FOUR axioms that inequality measures ought to satisfy: • The weak principle of transfers • Income scale independence • The principle of population • Decomposability
1. Weak Principle of transfers • Means that the inequality measure increases when the Lorenz curve goes wholly outside. 2. Income scale independence • Is satisfied when the inequality measure is unaffected by proportional changes of everyone’s income.
3. The principle of population • Implies that the inequality measure is independent of population changes under constant income shares. 4. Decomposability • Means that inequality of the whole population is a consistent function of the inequality in its subgroups.
Any inequality measure that satisfies these FOUR axioms is a generalized entropy measure
MLD is one of these generalized inequality measures : • So MLD is decomposable as follows :
MLD is used to decompose Thailand’s income inequality into inter- and intra- regional inequalities for an overview, using data from Household Socio-Economic Survey.
2. Household Socioeconomic Survey : • Its objective is to collect data on income, expenditure, and other characteristics of households. • The data of the late 1970s and early 1980s shows that, the income distribution increased rapidly in this period. • Five regions : Greater Bangkok Metropolitan Area, Central Region, Northern Region, Northeastern Region, Southern Region.
3. Inequality Decomposition • The whole kingdom is divided into 13 sub regions to obtain interregional and intraregional inequalities. • The whole kingdom MLD is calculated using data from Ikemoto and Uehara (2000) which provided average household income by deciles groups of households ordered by household income.
The bar chart shows regional decompositions of the whole kingdom MLD, the interregional inequalities are much smaller than the intraregional inequality therefore; The shares of intergroup inequalities increase as smaller subdivisions are employed.
EMPIRICAL FRAMEWORK Five factors that are Needed to be considered:- Relative variability of agricultural/nonagricultural sectors Income Financial services Education level disparity Aging Note: Civil liberty or trade openness are not necessary to take into account country-specific factors of an existing cross-country inequality analysis.
Agricultural and Nonagricultural Sectors • The share of agricultural in GDP are used as an independent variable according to Ahluwalia (1976) • Labor productivity are used as a more natural variable according to Bourguignon and Morrisson (1998) • According to Kuznets (1955), these variables try to capture directly the effect of the agricultural sector. ** However, the relative labor productivity is imperfect because it does not take into account the population share of the agricultural sector at all.
Table 1 shows the occupational classification The HSES provides average household incomes for nine occupational groups. Farm Operators, (mainly owning land and renting land) and Farm Workers are classified as agricultural households. Others are nonagricultural households.
DUAL interpreted as an intersectoral inequality measured - This interpretation leads us to put MLD or the Gini coefficient between the agricultural and nonagricultural sectors since DUAL is large under relative household income disparity and even household share of agricultural and nonagricultural sectors. - When income within the two sectors is equalized, MLDB and GINIB are MLD and Gini coefficient of the regional population. • Income distribution variation cannot be explained by other determinants of income inequality; thus, the key point of a regression analysis is to clarify if income distribution between the agricultural and nonagricultural sectors can explain part of the total income distribution variation. Also it is tautological to explain total income distribution by the income distribution between theses two agricultural and nonagricultural sectors according to Bourguignon and Morrisson (1998).
Figure 5 SHARE AND RELATIVE INCOME OF AGRICULTURAL HOUSEHOLDS This figure shows the changes in share and relative income of agricultural households.
Income • Most empirical studies of income distribution include income level or per capita GDP as an explanatory variable • Agricultural variables are included in the regression equation but may not be able to capture all the distributional changes caused by sectoral factors of the economy. - For example, economic growth accompanied by a sectoral shift from traditional industry to high-tech or service industry can lead to increased income inequality. Thus, household income, along with agricultural variables, is included in the regression equation.
Financial Service • The effect of financial service development on income distribution is not straightforward. • The development also locks in inequality. • Developed financial services are often unavailable for the poor.
Education Level Disparity • Education level disparity is a determinant of income inequality on the assumption that more education leads to more income The appendix gives the estimation method.
Aging Figure 6 shows that Thailand’s population is aging by using the average age of household heads denoted by AGE as an explanatory variable to take into account the relationship between aging and distribution. • Inequality should grow with age according to Deaton and Paxson (1994). • In Japanese household survey data, half of the increase in the economy wide consumption inequality during the 1980s could be explained by population aging.
Regression Result • Data gathered from year 1975-1998. no. of observation is 116
by using MLD and Dual as a inequality measurement The p values is < 1 % Thus, reject the validity
The p value < 1 % . This rejected the validity Using Gini coefficient instead of MLD Insignificant due to the fact that Thailand still a developing country
Stays significant, due to the stronger variables Whereas ,Fin and Edu are insignificant Negative sign Implied that financial development Decreased income inequality
Standardized coefficient of Table 4a and 4b The standardized coefficients show that the effects for variables capturing sectoral factors dominate the effect of the other determinants
Conclusion • The changed in sector of industry from the agriculture to nonagricultural play very effective role in determining the income distribution in Thailand. • The impact of the shift in sector of industry seems to be larger than other variables. • Thus, the increasing in income inequality in Thailand are mainly come from the changed in sectoral