
Download
1 / 1
Télécharger la présentation 
Z-Chart Loss Function
An Image/Link below is provided (as is) to download presentation
Download Policy: Content on the Website is provided to you AS IS for your information and personal use and may not be sold / licensed / shared on other websites without getting consent from its author.
Content is provided to you AS IS for your information and personal use only.
Download presentation by click this link.
While downloading, if for some reason you are not able to download a presentation, the publisher may have deleted the file from their server.
During download, if you can't get a presentation, the file might be deleted by the publisher.
E N D
Presentation Transcript
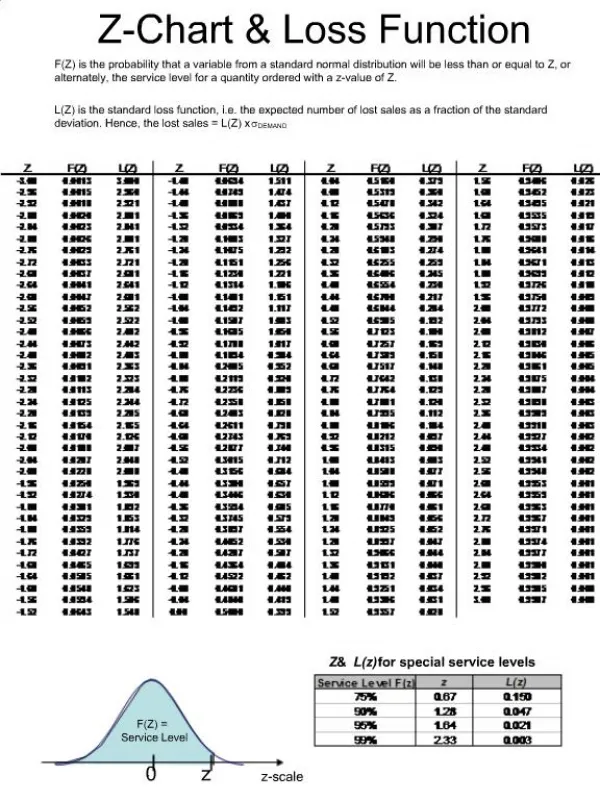
1. Z-Chart & Loss Function F(Z) is the probability that a variable from a standard normal distribution will be less than or equal to Z, or alternately, the service level for a quantity ordered with a z-value of Z.
L(Z) is the standard loss function, i.e. the expected number of lost sales as a fraction of the standard deviation. Hence, the lost sales = L(Z) x sDEMAND


More Related