Download
1 / 30
300 likes | 580 Vues
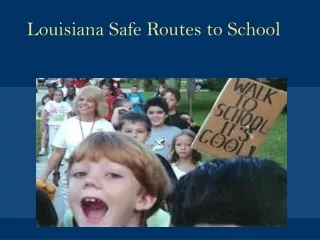
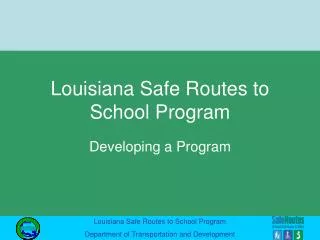
Louisiana Safe Routes to School Program. Developing a Program. To enable and encourage children, including those with disabilities, to walk and bicycle to school.

E N D
Louisiana Safe Routes to School Program Developing a Program
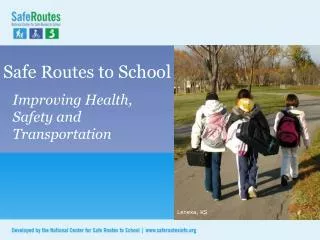
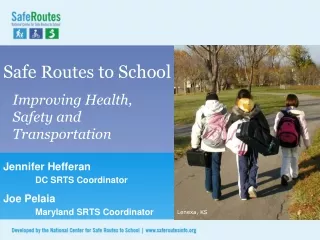
To enable and encourage children, including those with disabilities, to walk and bicycle to school. To make bicycling and walking to school a safer and more appealing transportation alternative, thereby encouraging a healthy and active lifestyle from an early age; and Continued on next slide PURPOSE(Section 1404(b) of the legislation)
To facilitate the planning, development and implementation of projects and activities that will improve safety and reduce traffic, fuel consumption, and air pollution in the vicinity of schools. PURPOSE (Continued)
Increased bicycle, pedestrian, and traffic safety More children walking and bicycling to and from school Decreased traffic congestion Improved childhood health and reduced obesity Encouragement of healthy and active lifestyles Improved community safety Reduced fuel consumption continued on next slide Desired Outcomes
Increased community security Enhanced community accessibility Increased community involvement Physical improvements that increase the ability to walk and bike to school Improved partnerships among schools, local government, parents, etc. Increased interest in bicycle and pedestrian accommodations throughout the community Desired Outcomes(Continued)
Engineering Education Encouragement Enforcement Evaluation Comprehensive Strategies The 5 E’s
Creates safer conditions for walking and bicycling Can influence the way people behave Engineering West Valley City, UT
Imparts safety skills Creates safety awareness Fosters life-long safety habits Includes parents, neighbors and other drivers Education Chicago, IL
Increases popularity of walking and bicycling Is an easy way to start SRTS programs Emphasizes fun Encouragement Elmhurst, IL
Increases awareness of pedestrians and bicyclists Improves driver behavior Helps children follow traffic rules Enforcement Richmond, VA Denver, CO
Monitoring Documenting Include Collection Of Before And After Data Evaluation(Are we making a difference?)
IdentifyThe Problem(s) Develop Solutions Physical improvements Activities Estimate Cost Develop An Action Plan Develop An Evaluation Plan Developing a SRTS Improvement Program
Organize Assess Current Environment Assess Existing Infrastructure Identify Safety Problems Problem Identification“No spin – just the facts”
SCHOOL (Principal, staff, student) LOCAL GOVERNMENT (Enforcement, DPW, School Board, etc.) PARENTS (PTO/PTA, etc.) OTHER INTERESTED PARTIES ENGINEER (Traffic or other) CHAMPION (Someone who can keep things moving) Organize(Form A Team)
Identify Students Who: Currently Walk Or Bike To School Take Bus Or Driven To School Live Within One Or Two Miles Of School Could Potentially Walk Or BikeTo School Assess Current Environment
Use surveys to determine how many children currently walk or bike to school or how many currently take a bus or are driven to school Use a map to locate where children live within one or two miles of a school. Determine the routes that they use to get to school. Estimate the number who could potentially walk or bike to school Assessment Tools
Actual Safety Problems Perceived Safety Problems Identify Safety Problems
OBSERVATIONS Around the school, along the school route, crossing the street, traffic behavior etc. CRASH DATA Actual crash data from local police CRIME DATA Actual Safety Problems
Surveys Parents Children Perceived Safety Problems
Weather Heavy Backpacks Too Far Etc. Other Problems
Sidewalks, Paths, Etc Barriers Operations Other Problems Assess Infrastructure
IMPROVE FACILITIES Engineering CHANGE DRIVER BEHAVIOR Engineering Enforcement ENCOURAGE STUDENTS/PARENTS EDUCATE Students/parents/teachers Identify Potential Solutions
First, consider low cost, easy to implement solutions Identify and program longer-term improvement needs Match the treatment to the problem Engineering Solutions
Provide Safe Street Crossings Keep it simple Shorten crossing distances Carefully select crossing locations and marked crosswalks Control Traffic Speed Engineering Solutions(Cont.)
Identify The Impact Of The Proposed Solution To The Identified Problem Increased Safety? More children walking/bicycling to school? Reduced speeds? Change in behavior? Link The Solution To The Problem
Engineering Construction Operations Develop Infrastructure Cost Estimates
Encouragement Education Enforcement Develop Non-Infrastructure Cost Estimates
List All Identified Problems And Solutions With The Cost Of Each Prioritize Develop A Time Frame For Accomplishing Identify Potential Source Of Funds For Each Identify Steps To Put Plan Into Motion Develop An Action Plan
Safety Benefits Behavioral Changes Other Benefits Pre-project Vs Projected Post Project Data Long Term Evaluation Develop an Evaluation Plan(Measures Of Success)
Get Organized Gather Information Identify Problems Identify Solutions Make a Plan Identify funding sources Act on the Plan Summary