Download
1 / 20
200 likes | 318 Vues
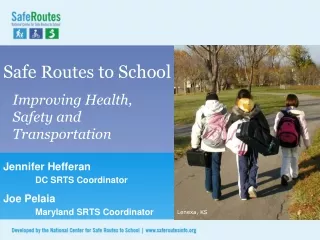
The Safe Routes to School (SRTS) program aims to address barriers that prevent children from walking and biking to school, promoting increased physical activity and independence. This presentation highlights the decline in school commute by walking and biking, outlines the associated health impacts, and suggests strategies for implementing SRTS programs. Key elements include community engagement, identifying existing issues, proposing solutions, and establishing evaluation methods. By fostering safe, appealing pathways for students, communities can improve air quality and reduce traffic congestion, enhancing the overall safety of school routes.

E N D
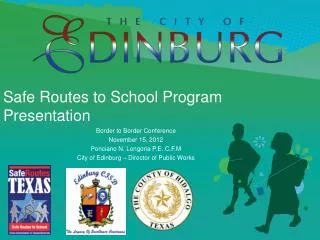
Safe Routes to School Program Presentation Border to Border Conference November 15, 2012 Ponciano N. Longoria P.E. C.F.M City of Edinburg – Director of Public Works
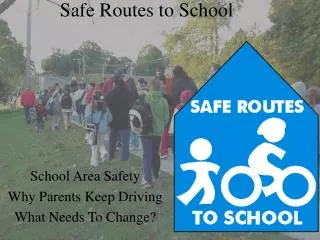
Barriers to walking and bicycling to school CommunityDesign Safety Time and Convenience
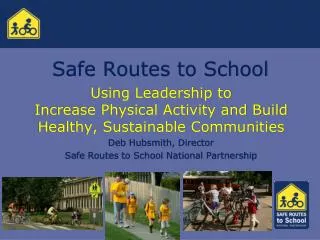
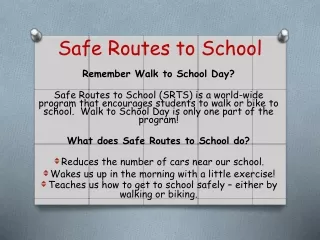
Reasons to do a Safe Routes to School Program Increased physical activity Increased independence Improved pedestrian skills More social interaction Reasons to do a Safe Routes to School Program Community design Reduced fear of crime Less reliance on automobile Decreased neighborhood/ school traffic
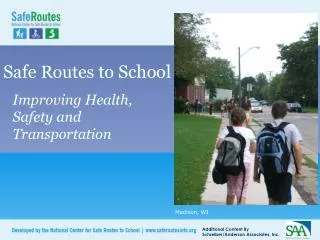
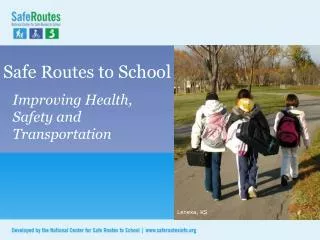
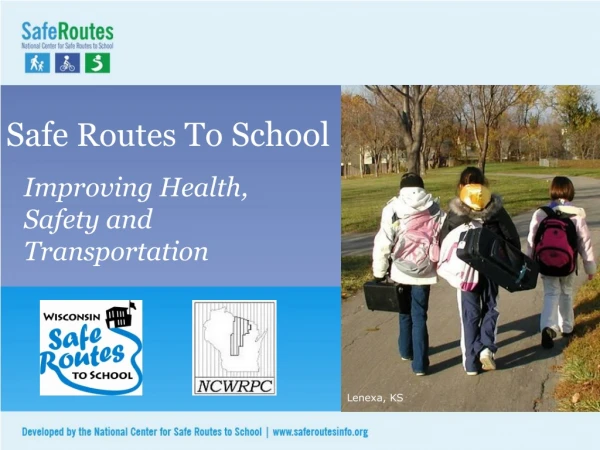
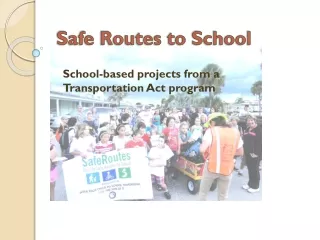
The Need for Safe Routes to School Fewer kids today walk and bike to school Unintended consequences have resulted SRTS programs can be part of the solution
1. Fewer kids are biking and walking More parents are driving • 19692009 • 48% walked or biked 13% walked or biked • 12% driven 44% driven • (U.S. DOT, 2009) • Parents driving their children to school account for up to 25% of morning rush hour traffic. • (Parisi Associates, 2003; Morris, 2001)
2.What are the unintended consequences of less walking and bicycling? • Physical Inactivity: • Prevalence of overweight children has tripled-Nationally there are 25 million obese or overweight children! • Sharp increase in cases of Type 2 Diabetes in children. • Poor Air Quality • Asthma rates have increased 160% in the past 15 years in children.
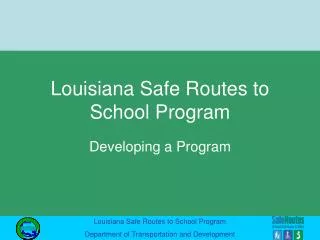
Safe Routes to School Programsa Key to the Solution Develop the Plan - Steps to start a SRTS Program • Identify people who want to make walking & bicycling to school safe and appealing for children. • Share concerns, interests, & knowledge among a variety of community members with diverse expertise can enable groups to tackle many different issues. • Hold a kick-off meeting-two main goals: to create a vision & generate next steps. • Gather information & identify issues-collecting information can help to identify needed program elements & provide a means to measure the impact of the program later. • Identify solutions-to issues identified by the group will include a combination of education, encouragement, engineering & enforcement strategies. • Develop a SRTS Plan-include all 5 E’s, time schedule, & map • Get the Plan & people moving-There are things that can be done right away without major funding? • Evaluate, adjust & keep going-after beginning, careful monitoring will identify which strategies are working well & which are not going as planned.
Whatis a SRTS Plan? Describes existing conditions Identifies existing problems Proposes solutions Describes coordination efforts Details evaluation methods
Describes Existing Conditions • Location of School(s) • Environment type (urban, suburban, rural) • Enrollment • Type of school (elementary/middle) • Student participation data (# of students, % students within 2 mi, % of students walking or biking, potential walking/biking outside 2 mi), % participating in free or reduced lunch prgm)
2.Identifies Existing Problems • ID current walking & bike routes to school (include graphic representation-pictures), highlights potential for improvement • Current travel modes including student survey results (including walk, bike, bus, auto) • Detailed analysis of existing conditions & impediments to safe biking/walking (physical barriers, safety issues, awareness) • Traffic, safety, & other relevant data including citations, crashes, injuries and/or fatalities, if applicable
3.Proposes Solutions • ID program “champion” person(s) to spearhead the effort • ID team or action committee that will develop/implement the plan & subsequent projects or activities • ID stakeholders-parents, students, teachers, elected officials & how they might contribute to development or execution of the plan
4.Describes Coordination Efforts • Policy Statement defining intent/mission • Outreach & publicity strategy • Responsibilities & tasks for enacting plan
5.Details Evaluation Methods • Activities to monitor, review & update process • How initiatives will be sustained • Methods & measures of success for the strategies • Reference to or inclusion of a non-motorized master plan or similar document
SRTS Joint Program Projects Awarded
Totals SRTS Phase I & II Total ECISD Schools 27 Campuses Total Miles of New Sidewalk 33.65 Miles Total ADA New Ramps 634 Ramps Total Crosswalks (New/Upgrade) 11 Crosswalks Total New School Beacons 70 Beacons Total New Bike Racks 161 Bike Racks Total Engineering Design Award $921,612.60 Total Construction Award $9,012,165.00 Total Project $9,973,777.60
Ponciano N. Longoria P.E. C.F.M. Director of Public Works City of Edinburg 415 W. University Dr. Edinburg, Texas 78540 (956) 388-8210 plongoria@cityofedinburg.com