
Download

1 / 3
Télécharger la présentation 
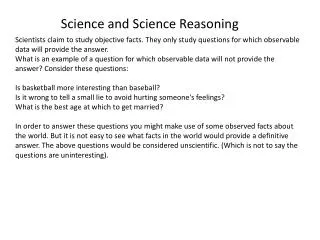
Science
An Image/Link below is provided (as is) to download presentation
Download Policy: Content on the Website is provided to you AS IS for your information and personal use and may not be sold / licensed / shared on other websites without getting consent from its author.
Content is provided to you AS IS for your information and personal use only.
Download presentation by click this link.
While downloading, if for some reason you are not able to download a presentation, the publisher may have deleted the file from their server.
During download, if you can't get a presentation, the file might be deleted by the publisher.
E N D
Presentation Transcript
Bar Graph -compare data that has been collected. Y axis X axis
Multiple bar graphs have bars with different colors or patterns to show the category that’s being compared.


More Related