Water Treatment Processes
Water Treatment Processes. ENVR 890 Mark D. Sobsey Spring, 2007. Water Sources and Water Treatment. Drinking water should be essentially free of disease-causing microbes, but often this is not the case.


Water Treatment Processes
E N D
Presentation Transcript
Water Treatment Processes ENVR 890 Mark D. Sobsey Spring, 2007
Water Sources and Water Treatment • Drinking water should be essentially free of disease-causing microbes, but often this is not the case. • A large proportion of the world’s population drinks microbially contaminated water, especially in developing countries • Using the best possible source of water for potable water supply and protecting it from microbial and chemical contamination is the goal • In many places an adequate supply of pristine water or water that can be protected from contamination is not available • The burden of providing microbially safe drinking water supplies from contaminated natural waters rests upon water treatment processes • The efficiency of removal or inactivation of enteric microbes and other pathogenic microbes in specific water treatment processes has been determined for some microbes but not others. • The ability of water treatment processes and systems to reduce waterborne disease has been determined in epidemiological studies
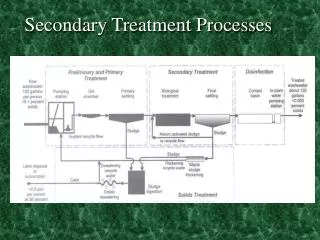
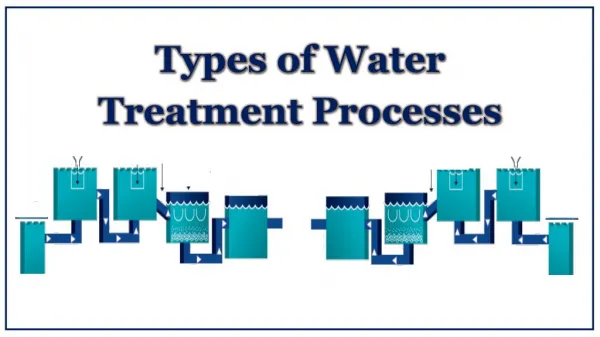
Summary of Mainline Water Treatment Processes • Storage • Disinfection • Physical: UV radiation, heat, membrane filters • Chemical: Chlorine, ozone, chlorine dioxide, iodine, other antimicrobial chemicals • Filtration • Rapid granular media • Slow sand and other biological filters • Membrane filters: micro-, ultra-, nano- and reverse osmosis • Other physical-chemical removal processes • Chemical coagulation, precipitation and complexation • Adsorption: e.g., activated carbon, bone char, etc, • Ion exchange: synthetic ion exchange resins, zeolites, etc.
Water Treatment Processes: Storage Reservoirs, aquifers & other systems: • store water • protect it from contamination • Factors influencing microbe reductions (site-specific) • detention time • temperature • microbial activity • water quality: particulates, dissolved solids, salinity • sunlight • sedimentation • land use • precipitation • runoff or infiltration
Water Storage and Microbial Reductions • Microbe levels reduced over time by natural antimicrobial processes and microbial death/die-off • Human enteric viruses in surface water reduced 400-1,000-fold when stored 6‑7 months (The Netherlands) • Indicator bacteria reductions were less extensive, probably due to recontamination by waterfowl. • Protozoan cyst reductions (log10) by storage were 1.6 for Cryptosporidium and 1.9 for Giardia after about 5 months (The Netherlands; G.J Medema, Ph.D. diss.) • Recent ICR data indicates lower protozoan levels in reservoir or lake sources than in river sources; suggests declines in Giardia & Cryptosporidium by storage
Chemical Coagulation-Flocculation Removes suspended particulate and colloidal substances from water, including microorganisms. Coagulation: colloidal destabilization • Typically, add alum (aluminum sulfate) or ferric chloride or sulfate to the water with rapid mixing and controlled pH conditions • Insoluble aluminum or ferric hydroxide and aluminum or iron hydroxo complexes form • These complexes entrap and adsorb suspended particulate and colloidal material.
Coagulation-Flocculation, Continued Flocculation: • Slow mixing (flocculation) that provides for for a period of time to promote the aggregation and growth of the insoluble particles (flocs). • The particles collide, stick together abd grow larger • The resulting large floc particles are subsequently removed by gravity sedimentation (or direct filtration) • Smaller floc particles are too small to settle and are removed by filtration
Microbe Reductions by Chemical Coagulation-Flocculation • Considerable reductions of enteric microbe concentrations. • Reductions In laboratory and pilot scale field studies: • >99 percent using alum or ferric salts as coagulants • Some studies report much lower removal efficiencies (<90%) • Conflicting information may be related to process control • coagulant concentration, pH and mixing speed during flocculation. • Expected microbe reductions bof 90-99%, if critical process variables are adequately controlled • No microbe inactivation by alum or iron coagulation • Infectious microbes remain in the chemical floc • The floc removed by settling and/or filtration must be properly managed to prevent pathogen exposure. • Recycling back through the plant is undesirable • Filter backwash must be disinfected/disposed of properly.
Cryptosporidium Removals by Coagulation (Jar Test Studies) Coagulant Dose (mg/L) Oocyst Removal, % (log10) Alum 5 99.8 (2.7) 1 87 (0.9) 99.5 (2.3) 97 (1.5) Iron 6 5
Granular Media Filtration • Used to remove suspended particles (turbidity) incl. microbes. • Historically, two types of granular media filters: • Slow sand filters: uniform bed of sand; • low flow rate <0.1 GPM/ft2 • biological process: 1-2 cm “slime” layer (schmutzdecke) • Rapid sand filters: 1, 2 or 3 layers of sand/other media; • >1 GPM/ft2 • physical-chemical process; depth filtration • Diatomaceous earth filters • fossilized skeletons of diatoms (crystalline silicate); powdery deposit; few 10s of micrometers; porous
Slow Sand Filters • Less widely used for large US municipal water supplies • Effective; widely used in Europe; small water supplies; developing countries • Filter through a 3‑ to 5‑foot deep bed of unstratified sand • flow rate ~0.05 gallons per minute per square foot. • Biological growth develops in the upper surface of the sand is primarily responsible for particle and microbe removal. • Effective without pretreatment of the water by coagulation‑flocculation • Periodically clean by removing, cleaning and replacing the upper few inches of biologically active sand
Microbial Reductions by Slow Sand Filtration • Effective in removing enteric microbes from water. • Virus removals >99% in lab models of slow sand filters. • Up to 4 log10; no infectious viruses recovered from filter effluents • Field studies: • naturally occurring enteric viruses removals • 97 to >99.8 percent; average 98% overall; • Comparable removals of E. coli bacteria. • Virus removals=99‑99.9%; • high bacteria removals (UK study) • Parasite removals: Giardia lamblia cysts effectively removed • Expected removals 99%
Roughing Filter • Used in developing countries • inexpensive • low maintenance • local materials • Remove large solids • Remove microbes • 1-2 log10 bacterial reduction • 90% turbidity reduction
Microbe Reductions by Rapid Granular Media Filters • Ineffective to remove enteric microbes unless preceded by chemical coagulation‑flocculation. • Preceded chemical coagulation‑flocculation & sedimentation • Enteric microbe removals of 90->99 % achieved. • Field (pilot) studies: rapid sand filtration preceded by iron coagulation‑flocculation: virus removal <50% (poor control?). • Giardia lamblia: removals not always high; related to turbidity removal; >99% removals reported when optimized. • Removal not high unless turbidity is reduced to 0.2 NTU. • Lowest removals shortly after filter backwashing • Microbes primarily removed in filter by entrapped floc particles. • Overall, can achieve 90% microbial removals from water when preceded by chemical coagulation‑flocculation.
Microbe Reductions by Chemical Coagulation-Flocculation and Filtration of River Water by Three Rx Plants in The Netherlands Plant 1 used two stages of iron coagulation‑flocculation‑sedimentation. Plant 2 used iron coagulation‑flocculation‑sedimentation and rapid filtration Plant 3 used iron coagulation‑flotation‑rapid filtration.
Cryptosporidium Removals by Sand Filtration Reduction Type Rate (M/hr) Coagulation % (log10) Rapid, shallow 5 No 65 (0.5) Rapid, shallow 5 Yes 90 (1.0) Rapid, deep 6 Yes 99.999 (5.0) Slow 0.2 No 99.8 (2.7)
Cryptosporidium Removal by Coagulation and Direct Filtration Log10 Reduction of Run No. Cryptosporidium Turbidity 1 3.1 1.3 2 2.8 1.2 3 2.7 0.7 4 1.5 0.2* Mean 2.5 0.85 Raw water turbidity = 0.0 - 5.0 NTU Alum coagulation-flocculation; Anthracite-sand-sand filtration; 5 GPM/ft2 *Suboptimum alum dose Ongerth & Pecoraro. JAWWA, Dec., 1995
Reported Removals of Cryptosporidium Oocysts by Physical-Chemical Water Treatment Processes (Bench, Pilot and Field Studies) Process Log10 Reduction Clarification by: Coagulation flocculation-sedimentation <1 - 2.6 or Flotation Rapid Filtration (pre-coagulated) 1.5 - >4.0 Both Processes <2.5 - >6.6 Slow Sand Filtration >3.7 Diatomaceous Earth Filtration >4.0 Coagulation + Microfiltration >6.0 Ultrafiltration >6.0
Cryptosporidium Reductions by Coagulation and Filtration Laboratory studies on oocyst removal: - Jar test coagulation with 1 hr. setting = 2.0 - 2.7 log10 - Sand filtration, no coagulant, 10 cm bed depth = 0.45 log10 - Sand filtration, plus coagulation, 10 cm bed depth = 1.0 log10 Gregory et al., 1991. Final Report. Dept. of the Environ., UK
Membrane Filters • More recent development and use in drinking water • Microfilters: several tenths of M to M diameter pore size • nano- & ultra-filters: retention by molecular weight cutoff • Typically 1,000-100,000 MWCO • Reverse osmosis filters: pore size small enough to remove dissolved salts; used to desalinate (desalt) water as well as particle removal • High >99.99% removal of cellular microbes • Virus removals high >9.99% in ultra-, nano- and RO filters • Virus removals lower (99%) by microfilters • Membrane and membrane seal integrity critical to effective performance
Cryptosporidium Reductions by Membrane Filtration Log10 Cryptosporidium Reduction Membrane, Type Pore Size A, MF 0.2 µm >4.4 B, MF 0.2 µm >4.4 C, MF 0.1 µm 4.2->4.8 D, UF 500 KD >4.8 E, UF 300 KD >4.8 F, UF 100 KD >4.4 MF = microfilter filter; UF = ultrafilter Jacangelo et al., JAWWA, Sept., 1995
Adsorbers and Filter-Adsorbers Adsorbers: • Granular activated carbon adsorption • remove dissolved organics • poor retention of pathogens, esp. viruses • biologically active; develops a biofilm • can shed microbes into water Filter-adsorbers • Sand plus granular activated carbon • reduces particles and organics • biologically active • microbial retention is possible
Cryptosporidium Removals by Sand Filtration Reduction Type Rate (M/hr) Coagulation % (log10) Rapid, shallow 5 No 65 (0.5) Rapid, shallow 5 Yes 90 (1.0) Rapid, deep 6 Yes 99.999 (5.0) Slow 0.2 No 99.8 (2.7)
Cryptosporidium Reductions by Membrane Filtration Membrane, Type Pore Size Log10 Cryptosporidium Reduction A, MF 0.2 µm >4.4 B, MF 0.2 µm >4.4 C, MF 0.1 µm 4.2->4.8 D, UF 500 KD >4.8 E, UF 300 KD >4.8 F, UF 100 KD >4.4 MF = microfilter filter; UF = ultrafilter Jacangelo et al., JAWWA, Sept., 1995
Water Softening and Microbe Reductions • ”Hard" Water: contains excessive amounts of calcium and magnesium ions • iron and manganese can also contribute to hardness. • Hardness ions are removed by adding lime (CaO) and sometimes soda ash (Na2CO3) to precipitate them as carbonates, hydroxides and oxides. • This process, called softening, is basically a type of coagulation‑flocculation process. • Microbe reductions similar to alum and iron coagulation when pH is <10 • Microbe reductions >99.99% possible when pH is >11 • microbial inactivation + physical removal
Microbial Reductions by Softening Treatment • Softening with lime only (straight lime softening); moderate high pH • ineffective enteric microbe reductions: about 75%. • Lime‑soda ash softening • results in the removal of magnesium as well as calcium hardness at higher pH levels (pH >11) • enteric microbe reductions >99%. • Lime‑soda ash softening at pH 10.4, 10.8 and 11.2 has produced virus reductions of 99.6, 99.9 and 99.993 percent, respectively. • At lower pH levels (pH <11), microbe removal is mainly a physical process • infectious microbes accumulate in the floc particles and the resulting chemical sludge. • At pH levels above 11, enteric microbes are physically removed and infectivity is also destroyed • more rapid and extensive microbe inactivation at higher pH levels.
Disinfection of Microbes in Water: Conventional Methods used in the Developed World • Historically, the essential barrier to prevention and control of waterborne microbial transmission and waterborne disease. • Free chlorine: HOCl (hypochlorous) acid and OCl- (hypochlorite ion) • HOCl at lower pH and OCl- at higher pH; HOCl a more potent germicide than OCl- • strong oxidant and relatively stable in water (provides a disinfectant residual) • Chloramines: mostly NH3Cl: weak oxidant; provides a stable residual • ozone, O3 , strong oxidant; provides no residual (too volatile and reactive) • Chlorine dioxide, ClO2,, string oxidant but not very stable residual • Concerns due to health risks of chemical disinfectants and their by‑products (DBPs), especially free chlorine and its DBPs • UV radiation • low pressure mercury lamp: low intensity; monochromatic at 254 nm • medium pressure mercury lamp: higher intensity; polychromatic 220-280 nm) • reacts primarily with nucleic acids: pyrimidine dimers and other alterations
Disinfection Kinetics • Disinfection is a kinetic process • Increased inactivation with increased exposure or contact time. • Chick's Law: disinfection is a first‑order reaction. (NOT!) • Multihit-hit or concave up kinetics: initial slow rate; multiple targets to be “hit” • Concave down or retardant kinetics: initial fast rate; decreases over time • Different susceptibilities of microbes to inactivation; heterogeneous population • Decline of of disinfectant concentration over time • CT Concept: Disinfection can be expressed at the product of disinfectant concentration X contact time • Applies best when disinfection kinetics are first order • Disinfectant concentration and contact time have an equal effect on CT products • Applies less well when either time ofrconcentration is more important.
DISINFECTION AND MICROBIAL INACTIVATION KINETICS First Order Multihit Log Survivors Retardant Contact Time
Factors Influencing Disinfection of Microbes • Microbe type: disinfection resistance from least to most:vegetative bacteria viruses protozoan cysts, spores and eggs • Type of disinfectant: order of efficacy against Giardia from best to worst • O3 ClO2 iodine/free chlorine chloramines • BUT, order of effectiveness varies with type of microbe • Microbial aggregation: • protects microbes from inactivation • microbes within aggregates can not be readily reached by the disinfectant
Effects of Water Quality on Disinfection • Particulates: protect microbes from inactivation • microbes shielded or embedded in particles • Dissolved organics: protects • consumes or absorbs (UV radiation) disinfectant • coats microbes • Inorganic compounds and ions: effects vary with disinfectant • pH: effects depend on disinfectant. • Free chlorine more biocidal at low pH where HOCl predominates. • Chlorine dioxide more microbiocidal at high pH • Reactor design, mixing and hydraulic conditions; better activity in "plug flow" than in "batch‑mixed" reactors.
Inactivation of Cryptosporidium Oocysts in Water by Chemical Disinfectants Disinfectant CT99 (mg-min/L) Reference Free Chlorine 7,200+ Korich et al., 1990 Monochloramine 7,200+ Korich et al., 1990 Chlorine Dioxide >78 Korich et al., 1990 Mixed oxidants Venczel et al., 1997 <120 Ozone ~3-18 Finch et al., 1994 Korich et al., 1990 Owens et al., 1994 C. parvum oocysts inactivated by low doses of UV radiation: <10 mJoules/cm2
Disinfection: A Key Barrier Against Microbes in Water • Free chlorine still the most commonly used disinfectant • Maintaining disinfectant residual during treated water storage and distribution is essential. • A problem for O3 and ClO2, which do not remain in water for very long. • A secondary disinfectant must be used to provide a stable residual • UV radiation is a promising disinfectant because it inactivates Cryptosporidium at low doses • UV may have to be used with a chemical disinfectant to protect the water with a residual through distribution and storage