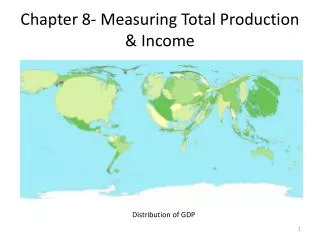
Measuring Production
Measuring Production. Gross Domestic Product. G. P. D. Circular Flow Diagram. Government. National Income. Rest of World. Taxes. K. Government Spending. Firms. Households. Savings. Consumption. Stocks, Funds Bonds, CD ’ s, Life Insurance. Total Production. Saving Pool.

Measuring Production
E N D
Presentation Transcript
Measuring Production Gross Domestic Product G P D
Circular Flow Diagram Government National Income Rest of World Taxes K Government Spending Firms Households Savings Consumption Stocks, Funds Bonds, CD’s, Life Insurance Total Production Saving Pool Investment
How is this number important? National Income The more goods and services we produce, the more Income is generated and the better our ability to satisfy needs. Total Production 15.8 T
2011 U.S is #1
Does this mean that the U.S. grows faster than any other country?
2012 U.S. is not in the list!
Does this mean that Americans are the richest in terms of income per person?
2010-2011 U.S Drops from # 1 to #14
Personal Income ~Half the population makes less than $25,000/year ~75% the population makes less than $50,000/year Most of the population makes less than $100,000/year Median Household Income = $50,000(2011)
~Half the population makes less than $25,000/year A family of four making 25,000 a year is $2,000 above the poverty threshold
Top 10% Top 10% 83% 73% Exclude home value
1/3 Income 10% 43% Fin. Wealth 35% Wealth 1% 1% 1/3 Income 30% 90% 27% Wealth 17% Fin. Wealth 90% 1/3 Income 60% 9% 38% Wealth 40% Fin. Wealth 9% Income Distribution U.S. If we divide Income: The richest ten percent of the population gets a third, the next thirty percent gets another third, and the bottom sixtypercent get the last third.
One of the highest levels of income inequality among high income countries Income Richest Income Poorest
Can not be used for cross country comparisons unless we add both: income distribution and population size. GDP alone is not a good measure of wellbeing We need to know how this income is distributed.
To Measure Production Incomes Approach Ask individuals how much income they earned Government Taxes Pay taxes Buys goods Save Buy goods and services Saving Buy equipment and buildings Interest Rent Profits Wages Rest of World Buys goods and services Firms Households Goods and Services Ask firms how much they produced Ask firms how much they SOLD Expenditures Approach Value Added Approach =300
Chapter 8 Appendix “National Income Accounting”. The Expenditures Approach
GDP includes ONLY NEW production GDP Sum of expenditures on new,final goods and services produced in the U.S during the year.
to G Taxes pay T NX S C Saving I Interest Rent Profits Wages Circular Flow Diagram Rest of World G Firms Households Goods and Services Sold GDP
The Expenditures Approach GDP is the sum of purchases made by • Consumers • Firms • The Government • Other Countries Consumption (C) Investment (I) Government (G) Spending Exports
The Expenditures Approach GDP = C + I + G + NX
GDP adds purchases of Final Goods ONLY! …Excludes intermediate goods
Final Good A good (or service) available for purchase by the ultimate or intended (end) user with no plans for further transformation or as an input in the production of other goods that will be resold.
Final Goods can be… • Durable: last a relatively long time. • Non-durable : perishable. • Services: intangibles, do not represent production of physical things.
Intermediate Good A good (or service) that is used as an input or component in the production of another good. Intermediate goods are combined into the production of final goods. Intermediate goods will be further processed before sold as final goods.
Car Manufacturer purchase windows from window manufacturer at $300 each Consumer buys the car for $16,000. Car Manufacturer purchase tires from tire manufacturer at $200 each
Total Sales 2 Windows = 600 4 tires = 800 1 car = 16,000 Total Sales = 17,400 Include twice the value of the tires and the windows Total Sales
Market transactions that capture the value of intermediate goods are not included separately in gross domestic product. GDP Excludes Intermediate Goods GDP seeks to measure the market value of final goods. The value of intermediate goods is included in the value of final goods To do so would create the problem of double counting.
Investment The purchase of capital goods
Capital Good A good that is a manufactured (or previously produced) factor of production that is used to produce other things. Examples: factories, buildings, trucks, tools, machinery, and equipment used by businesses.
Depreciation Flour Flour Sugar Sugar Depreciates Oven
New Capital (Investment) goods • Are used to produce other goods just like intermediate goods. • Are not entirely used up in production of the final good like intermediate goods are. • Depreciate (are used up) as they are used to produce final goods. • Purchases of capital goods are ADDED into GDP at full value.
Households purchase Durable goods Non-durable Services AND Houses Consumption Residential Investment
GDP Includes Investment Long lived assets which will contribute to production in the future. • Equipment, tools, software (1999). • NEW Residential Construction • Consumer purchases of new houses and condominiums generate flow of housing services for years to come. • NEW Non-residential construction: shopping malls, factories, airports. • Changes in Inventories: unsold goods are included as investment.
Education Long lived asset which will contribute to production in the future. But is not considered investment
Government National Income Rest of World Taxes Government Spending Firms Households When you buy bonds and stocks you are NOT investing you are Saving. Savings Consumption Stocks, Funds Bonds, CD’s, Life Insurance Total Production Saving Pool Investment
GDP Excludes Paper Goods Bonds, stocks, Certificates of Deposit (CD’s), These do not represent a good or service that satisfies needs but are considered SAVING instruments.
Payment for which the government does NOT receive a good or a sevice Government Purchases G • Include expenditures by federal, state and local governments. • Include final, intermediate and capital goods purchased by the government. • Exclude transfer payments (social security, unemployment benefits, etc)
Government Production • These goods and services are not sold. • Government production is counted into GDP when the government purchase the inputs necessary to produce these goods and services. • Government production is added to GDP at the value of the inputs used to produce them.
Net Exports NX • Exports: sales of US goods to foreigners. • Imports: US purchases of goods and services from the rest of the world. Net Exports NX = X - M
Why do we subtract Imports from GDP? • Imports are goods produced abroad, they do not represent domestic production and as such should not be included into GDP. • We could simply NOT include them in GDP: C + I + G + X • We must subtract them, because imports are already included in all the other components: • Consumption and Investment include expenditures on domestic as well as imported goods.
GDP Excludes Non-Market Activities • Goods or services produced but not traded in a market (goods for which there is no price) are NOT included in GDP • Examples: house work, home improvement projects, services of friend or relative, borrowed labor.
GDP Excludes Underground Markets There is NO REPORTED data to use Illegal
GDP is NOT equal to total sales GDP excludes: • Sales of intermediate goods • Sales of paper goods • Sales of used goods • Sales of illegal goods • Bartered goods and services.
Bullet proof vests purchased by military. • Bullet proof vest purchased by Security Company. • New goods • Intermediate Good purchased by firms • Capital Good • Newly produced goods no one purchased • House • Tools • Cash for clunkers • Computer purchased by the government. • Coffee and pastries purchased by the government for their offices. • Coffee and pastries purchased by Ford for their offices. • Goods manufactured in other countries
Limitations of GDP • Excludes non-market production of goods or services • Child care, elderly care, cooking, cleaning, gardening, home projects, farming. • Excludes Underground production of goods or services • Illegal and legal goods and services not reported to tax authority.
Limitations of GDP continued… • GDP does not “subtract” for depletion destruction of environment due to production/disaster. It adds all expenditures to rebuild and clean up. • Deforestation of the Rain Forest by logging companies is counted as a plus into GDP. • Clean up for an oil spill is counted as a plus into GDP. Contamination, destruction of marine life not subtracted. • Leisure is unaccounted for… • In the 50’s one income was enough to support a family in 90’s most families require two people working full time. • Americans work two months more than their counterparts in Germany and France…
Government National Income Rest of World Taxes Government Spending Net Exports Firms Households Savings Consumption Expenditures Approach GDP = C+I+G+X-M Stocks, Funds Bonds, CD’s, Life Insurance Total Production Saving Pool Investment
Expenditures Approach (Billions) C = 71% I = 13% NX = -4% G = 20%