Download

1 / 70
730 likes | 1.21k Vues
Nutrition and the Physiology of Malnutrition. Lia Fernald, Ph.D., M.B.A. Human Biology Lecture May 14, 2002. Male, 17, Oakland, weekly diet. B. L. S. D. 3,045 (38%). 2,400 (41%). 2,739 (33%). 3,163 (36%). Overweight 9 th graders in the Bay Area.

E N D
Nutrition and the Physiology of Malnutrition Lia Fernald, Ph.D., M.B.A. Human Biology Lecture May 14, 2002
Male, 17, Oakland, weekly diet B L S D 3,045 (38%) 2,400 (41%) 2,739 (33%) 3,163 (36%)
Overweight 9th graders in the Bay Area “Overweight” defined as more than 25% body fat for boys and more than 32% for girls. Less than 1% of students are out of shape because they are too thin.
Today’s Class • Overview of Nutritional Requirements • Definition of Malnutrition • Causes and correlates of Malnutrition • Measurement and Types of Malnutrition • Severe Malnutrition • Mild/Moderate Malnutrition (Underweight and Stunting) • Specific Nutritional Deficiencies (Iodine and Iron)
Macro v. micro nutrients • Macro-nutrients • Protein (amino acids) • Energy (carbohydrates) • Fat (fatty acids) • Micro-nutrients • Water soluble vitamins (assist in energy-release of carbohydrates and red blood cell formation) • Fat soluble vitamins (development & metabolism) • Minerals
Macro-nutrients • Energy • Necessary for all bodily function • Protein • Necessary for structural development (muscle and bone) • Fat • Necessary for cell membrane and skin cell development
Water soluble vitamins • Thiamin B • nervous system function, enzymatic energy release of carbohydrates (beef, pork, liver, legumes, breads) • Riboflavin B2 • Participants in enzymatic energy release of carbs, fat & protein (milk, dairy, dark green vegetables, yogurt) • Niacin • Participates in enzymatic energy release of energy nutrients (beef, pork, liver, breads, nuts) • Folate • Red blood cell formation, new cell division (veg, seeds) • Vitamin B12 (Cobalamin) • Red blood cell formation, nervous system maintainance (animal prod) • Pantothenic Acid • Biotin (Vitamin H, CoEnzyme R) • Vitamin B6 (Pyridoxine) • Vitamin C
Fat soluble vitamins • Vitamin A • Essential to vision, fetal development, immune response • Found in dairy products, fish liver oils; as B-carotene found in many plants (e.g. carrots, mango) • Vitamin D • Bone formation, calcium metabolism and absorption • Found in sunlight, egg yolk, dairy products and fish liver oil • Vitamin E • Cell membrane construction and maintenance • In fats and oils, green leafy vegetables, poultry, fish • Vitamin K • Blood clotting, protein synthesis • In green leafy vegetables, liver, cabbage
Minerals Major “Bone”MineralsTraceMinerals Calcium (bones) Iodine (thyroid function) Phosphorus (DNA) Iron (hemoglobin) Magnesium (bones) Zinc (enzyme, hormone) Sodium (nerve impulse) Copper (abs. of iron) Chloride (fluid balance) Flouride (bone & teeth) Potassium (prot. syn) Chromium (energy rel.) Sulfur (some a.a.’s) Molybdenum (enzymes) Manganese (enzymes) Selenium (antioxidant) Cobalt (part of B12)
Summary: Nutritional requirements • In order to live and function, humans need macro- and micro- nutrients; • Macro-nutrients are fat, protein and carbohydrates; • Micro-nutrients are water-soluble vitamins, fat-soluble vitamins, and minerals (bone and trace); the most critical micro-nutrients are iron, iodine, zinc, vitamin A and vitamin D.
Today’s Class • Overview of Nutritional Requirements • Definition of Malnutrition • Causes and correlates of Malnutrition • Measurement and Types of Malnutrition • Severe Malnutrition • Mild/Moderate Malnutrition (Underweight and Stunting) • Specific Nutritional Deficiencies (Iodine and Iron)
What is malnutrition? World Health Organization definition: The term is used to refer to a number of diseases, each with a specific cause related to one or more nutrients (for example, protein, iodine or iron) and each characterized by cellular imbalance between the supply of nutrients and energy on the one hand, and the body's demand for them to ensure growth, maintenance, and specific functions, on the other.
Geneva Declaration • 1924:Declaration of the Rights of the Child (also known as the Declaration of Geneva). • Adopted after World War I by the League of Nations through the efforts of British child rights pioneer • Marks the beginning of the international child rights movement and is also the first international affirmation of the right to nutrition. • Affirms that "the child must be given the means needed for its normal development, both materially and spiritually" and states that "the hungry child should be fed."
Death from malnutrition * * * At least 70% of childhood diseases are related with one of these conditions * * * Source: WHO, based on C.J.L. Murray and A.D. Lopez, The Global Burden of Disease, Harvard University Press, Cambridge (USA) 1996 and American Journal of Public Health 1993-83.
Summary: Definition of malnutrition • Malnutrition is having the inappropriate level of a micro- or macro- nutrient; • In some cases (i.e. the US), malnutrition can be associated with being grossly overweight; • In most of the world, malnutrition is defined as a LACK of nutrients; • Malnutrition contributes to over 50% of deaths in children in the world.
Today’s Class • Overview of Nutritional Requirements • Definition of Malnutrition • Causes and correlates of Malnutrition • Measurement and Types of Malnutrition • Severe Malnutrition • Mild/Moderate Malnutrition (Underweight and Stunting) • Specific Nutritional Deficiencies (Iodine and Iron)
Causes of malnutrition Child malnutrition death and disability Inadequate Disease Diet Inadequate maternal and child care Poor water/ sanitation inadequate health services Insufficient access to food
Impaired mental development Higher mortality rate Increased risk of adult chronic disease Reduced capacity to care for baby Baby Low Birth Weight Elderly Malnourished Untimely/inadequate weaning Frequent Infections Inadequate catch up growth Inadequate food, health & care Inadequate fetal nutrition Inadequate food, health & care Child Stunted Reduced mental capacity Start here Woman Malnourished Pregnancy Low Weight Gain Adolescent Stunted Inadequate food, health & care Reduced mental capacity Inadequate food, health & care Higher maternal mortality
Correlate: Unsafe Water 11% urban and 38% rural households do not have access to safe water Source for photos: Overseas Aid: www.nat.uca.org.au, Statistics, UNICEF State of the World’s Children 2000
Correlate: Inadequate Sanitation 21% urban and 75% rural households do not have access to adequate sanitation Source for photos: Overseas Aid: www.nat.uca.org.au, Statistics, UNICEF State of the World’s Children 2000
Correlate: Poor Education 25% of girls and 19% of boys do not enter primary school; 54% of girls and 45% of boys do not enter secondary school Source for photos: Overseas Aid: www.nat.uca.org.au, Statistics, UNICEF State of the World’s Children 2000
Correlate: Poverty 28% of the population lives at below $1 per day Average GNP per capita is $1299 (compared with $29,080 in USA) Source for photos: Overseas Aid: www.nat.uca.org.au, Statistics, UNICEF State of the World’s Children 2000
Correlate: Poor Stimulation 39% of females and 21% of males over the age of 15 cannot read or write 199 radios per 1000 population; 154 TV’s per 1000 population Source for photos: Overseas Aid: www.nat.uca.org.au, Statistics, UNICEF State of the World’s Children 2000
Correlate: Poor Public Health About 30% of 1-year olds are not fully immunized for TB, DPT (Diptheria, Pertussis, and Tetanus), polio and measles Source for photos: Overseas Aid: www.nat.uca.org.au, Statistics, UNICEF State of the World’s Children 2000
Correlate: No Breastfeeding Babies are twins (boy and girl) Mother was told that she wouldn’t have enough breast milk for both, so should bottle feed girl . . . girl died the day after this photo was taken 56% babies in developing countries are not breastfed from 0-3 months Source: Children’s Hospital Islamabad
Summary: Causes/correlates • Malnutrition rarely exists in isolation, and many other factors contribute to its detrimental impact; • Poor physical resources, and overcrowded homes • Poor sanitation and water supply • Low income • Parents with little education • Minimal interaction/stimulation in the home • Malnutrition has repercussions throughout the life cycle and is thus multi-generational (diagram with lots of arrows)
Today’s Class • Overview of Nutritional Requirements • Definition of Malnutrition • Correlates of Malnutrition • Measurement and Types of Malnutrition • Severe Malnutrition • Mild/Moderate Malnutrition (Underweight and Stunting) • Specific Nutritional Deficiencies (Iodine and Iron)
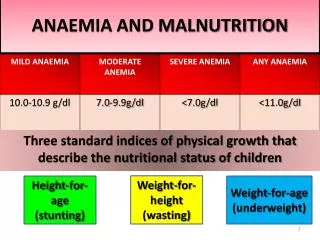
Types of malnutrition • Severe Protein-Energy Malnutrition (>3 S.D.) • Kwashiorkor (low protein) • Marasmus (low calories) • Mild/moderate undernutrition (>2 S.D.) • Stunting • Underweight • Wasting • Micro-nutrient deficiency • Iodine • Iron • Vitamin A • Vitamin D
Measurement of Malnutrition • STUNTING: Height for age – height compared to a reference population of the same age. = represents long term growth retardation • UNDERWEIGHT: Weight for age – weight compared to age in a reference population • WASTING: Weight for height – weight compared to a reference population of the same height.
Growth Curves (0-3 years) Length/ Height Weight Age
Summary: Measurement • There are several types of malnutrition, micro- and macro-malnutrition; • Measurement of severe malnutrition (>3 S.D.) and micro-nutrient deficiency usually occurs due to presence of critical signs (to be discussed); • Measurement of mild/moderate malnutrition (>2 S.D.) occurs with growth charts.
Today’s Class • Overview of Nutritional Requirements • Definition of Malnutrition • Correlates of Malnutrition • Measurement and Types of Malnutrition • Severe Malnutrition • Mild/Moderate Malnutrition (Underweight and Stunting) • Specific Nutritional Deficiencies (Iodine and Iron)
Severe malnutrition % <5 y.o. Developing Countries 12% Least Developed Countries 13% (India 21%, Bangladesh 21%, Cambodia 18%) Data for 1992-98, UNICEF State of the World’s Children 2000
Severe PEM: Real Numbers Example: India • 21% of all children under 5 • # children under 5 is 115,615,000 • 24M children severely malnourished (Bigger than population of Texas 20M) Example: All developing countries • Total # <5 in developing countries: 536,105,000 and 12% of that is: • 64M children under 5y.o. severely malnourished (California & New York & Florida) Example: World (total number is 603,449,000) 11% = 66M (France or England)
Kwashiorkor Infection Sparse hair Swollen belly Decreased muscle mass Pellagra Apathy
Kwashiorkor (low protein) • Decreased muscle mass(failure to gain weight and of linear growth) • Swollen belly (edema and lipid build-up around the liver) • Changes in skin pigment (pellagra); may lose pigment where the skin has peeled away (desquamated) and the skin may darken where it has been irritated or traumatized • Hair lightens and thins, or becomes reddish and brittle. • Increased infections and increased severity of normally mild infection, diarrhea • Apathy, lethargy, irritability Death does not occur from actual starvation but from secondary infection
Kwashiorkor – mechanisms • Occurs in reaction to emergency situations (famine) • Kwashiorkor more likely in areas where cassava, yam, plantain, rice and maize are staples, not wheat • Increased carbohydrate intake with decreased protein intake eventually leads to edema (water) and fatty liver
Marasmus (low calories) Ravenously hungry Gross weight loss & no fat
Marasmus • Deficit in calories – “marasmus” comes from Greek origin of word “to waste” • Gross weight loss • Hyper-alert and ravenously hungry • Children have no subcutaneous fat or muscle eventually starve to death (immediate cause often is pneumonia)
Marasmus – mechanism • Energy intake is insufficient for body’s requirements – body must draw on own stores • Liver glycogen exhausted in a few hours – skeletal muscle protein used via gluconeogenesis to maintain adequate plasma glucose • When near starvation is prolonged, fatty acids are incompletely oxidized to ketone bodies, which can be used by brain and other organs for energy • High cortisol and growth hormone levels Mechanism is same as anorexia
Severe Malnutrition: Consequences • Mental development • Lower IQ levels • Poorer school performance • Behaviors of recovered severely malnourished children • shy, isolated, withdrawn • decreased attention span • immature, emotionally unstable • fewer peer relationships/reduced social skills • played less/stayed nearer to mothers
Summary: Severe malnutrition • Severe malnutrition is defined as > 3 s.d. away from median reference standards; • 66M children under the age of 5 are severely malnourished (64M of these in developing countries); • Key types of severe malnutrition are kwashiorkor (low protein) and marasmus (low calories); • Severe malnutrition results in severe deficits for children
Today’s Class • Overview of Nutritional Requirements • Definition of Malnutrition • Correlates of Malnutrition • Measurement and Types of Malnutrition • Severe Malnutrition • Mild/Moderate Malnutrition (Underweight and Stunting) • Specific Nutritional Deficiencies (Iodine and Iron)
Stunting – Height for Age • Height for age reflects pre- and post- natal linear growth • “Stunting” refers to shortness that is not genetic, but due to poor health or nutrition • Most standard definition < 2 S.D. • Stunting is good cumulative measure of “well-being” for populations of children (because not affected by weight recovery)
Stunting These girls are: From same school and the same neighborhood Both have the same birthday
Stunting % <5 y.o. Developing Countries 39% Least Developed Countries 47% (India 52%, Bangladesh 55%, Cambodia 56%) Data for 1992-98, UNICEF State of the World’s Children 2000
Stunting: Real Numbers India where 52% of all children under 5 (total <5 is 115,615,000) are stunted 60M children in India are stunted (as many people live in the MidWest) Example all developing countries, where 39% of all children under 5 (536,105,000) 209M children in dev world In world, thetotal # of children <5 is 603,449,000 and 37% of that is 223M children in world (US popn 272M US minus California and Texas)