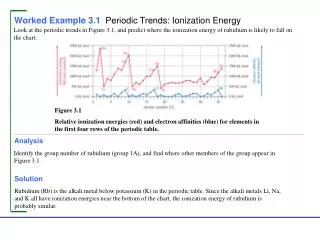
Example 3.1
The Monet Company produces four type of picture frames, which we label 1, 2, 3, 4. The four types of frames differ with respect to size, shape and materials used. ...

Example 3.1
E N D
Presentation Transcript
Example 3.1 Introduction to LP Modeling
Background Information • The Monet Company produces four type of picture frames, which we label 1, 2, 3, 4. • The four types of frames differ with respect to size, shape and materials used. • Each type requires a certain amount of skilled labor, metal, and glass as shown in this table. The table lists the unit selling price Monet charges for each type of frame.
Background Information -- continued • During the coming week Monet can purchase up to 4000 hours of skilled labor, 6000 ounces of metal, and 10,000 ounces of glass. • The unit costs are $8.00 per labor hour, $0.50 per ounce of metal, and $0.75 per ounce of glass. • Also, market constraints are such that it is impossible to sell more than 1000 type 1 frames, 2000 type 2, frames, 500 type 3 frames, and 1000 type 4 frames. • The company wants to maximize its weekly profit.
Traditional Algebraic Method • In the traditional algebraic solution method we first identify the decision variables. • In this problem they are the number of frames of type 1, 2, 3, and 4 to produce. We label these x1, x2, x3, x4. • Next we write total profit and the constraints in terms of the x’s. • Finally, since only nonnegative amounts can be produced, we add explicit constraints to ensure that the x’s are nonnegative.
Traditional Algebraic Method -- continued • The resulting algebraic formulation is shown below: Maximize 6x1 + 2x2 + 4x3 + 3x4 (profit objective) Subject to 2x1 + x2 + 3x3 + 2x4 4000 (labor constraint) 4x1 + 2x2 + x3 + 2x4 10,000 (glass constraint) x1 1000 (frame 1 sales constraints) x2 2000 (frame 2 sales constraints) x3 500 (frame 3 sales constraints) x4 1000 (frame 4 sales constraints) x1, x2, x3, x4 0 (nonnegativity constraint)
Traditional Algebraic Method -- continued • To understand this formulation, consider the profit objective first. The profit from x1 frames of type 1 is 6x1 because each frame contributes $6 to profit. • Profits for the other three types of frames are obtained similarly. Then the total profit is the sum of the profits from the four products. • Next consider the labor constraint. The right side, 4000, is the number of hours available. On the left side, each type 1 frame uses 2 hours of labor, so x1 units require 2x1 hours of labor. Similar statements hold true for the other three products, and the total number of labor hours used is the sum of them all.
Traditional Algebraic Method -- continued • The constraints for glass and metal are similar. • Finally, the maximum sales constraints and the nonnegativity constraints put upper and lower limits on the quantities that can be produced. • For many years all LP problems were formulated this way. Computer packages such as Lindo used this method of inputs. • In recent years a more intuitive method has emerged. This method utilizes spreadsheets and solver add-ins. These spreadsheets have the capability of solving (optimizing) LP problems.
Spreadsheet Modeling • There is no exact one way to develop an LP spreadsheet model. We will work through many examples so you can develop your own way. • The common elements in all LP spreadsheet models are the following. • Inputs. All numerical inputs – that is, the data needed to form the objective and the constraints – must appear somewhere in the spreadsheet. Our convention is to enclose all inputs in a blue border with shading. We normally place all inputs in the upper left corner. However, we sometimes violate this convention when certain inputs fit more naturally somewhere else.
Spreadsheet Modeling -- continued • Changing cells. Instead of using variable names, such as x’s, there is a set of designed cells that play the roles of the decision variables. The values in these cells can be changed to optimize the objective. In Excel these cells are called the changing cells. To designate them clearly our convention is to enclose them in a red border. • Target (objective) cell. One cell, called the target or objective cell, contains the value of the objective. The Solver systematically varies the values in the changing cells to optimize the value in the target cell. Our convention is to enclose the target cell in a double-line border.
Spreadsheet Modeling -- continued • Constraints. Excel does not show the constraints directly on the spreadsheet. Instead we specify constraints in a Solver dialog box. • Nonnegativity. Normally we want the decision variables – that is, the values in the changing cells – to be nonnegative. Except for in earlier versions of Excel, these constraints do not need to be written explicitly; we simply check a box that we want nonnegative changing cells. • In general, the complete solution of the problem involves three stages.
Spreadsheet Modeling -- continued • The first stage is to enter all the inputs, trail values for the changing cells, and formulas relating these in a spreadsheet. We call this formulating the model. • The second stage is invoking the Solver. At this point, we formally designate the objective cell, the changing cells, the constraints, and selected options, and we tell the Solver to find the optimal solution.
Spreadsheet Modeling -- continued • The third stage is sensitivity analysis. In most model formulation of real problems, we make “best guesses” for the numerical inputs to the problem. There is typically some uncertainty about quantities such as unit prices, forecasted demands, and resource availabilities. When we use Solver to solve the problem, we use out best estimates of these quantities to obtain the optimal solution. However, it is important o see how the optimal solution changes as we vary inputs. Also, a sensitivity analysis often gives us important insights about how the model works.
PRODUCTMIX.XLS • This file illustrates the solution procedure for Monet’s product mix problem. • The spreadsheet figure on the next page shows the model.
Developing the Model • The first stage is to setup the spreadsheet. • Inputs. Enter the various inputs in the shaded ranges. Enter only numbers, not formulas in the input cells. They should always be numbers straight form the problem statement. • Production levels. Enter any four values in the range we have named Produced. These do not have to be the values in the Figure. The Solver will find the optimal values. • Resources used. Enter the formula =SUMPRODUCT (B9:E9,Produced) in cell B21 and copy it to the rest of the Used range. These calculate the labor, metal, and glass used by the current product mix.
Developing the Model -- continued • Revenues, costs, and profits. The area from row 25 down shows the summary of monetary values. Actually all we need is the total profit in cell F32, but it is useful to calculate the revenues and costs associated with each product. • To obtain the revenues enter the formula =B12*B16 in cell B27 and copy this to the range C27:E27. • For the costs, enter the formula =$B4*B$16*B9 in cell B29 and copy this to the range B29:E31. • Then calculate profit for each product by entering the formula =B27-SUM(B29:B31) in cell B32 and copy this to the range C32:E32. • Finally calculate the totals in column F by summing across each row with the SUM function.
Developing the Model -- continued • The next step is to specify the changing cells, the objective cells, and the constraints in a Solver dialog box and then instruct the Solver to find the optimal solution. • Before we do this, it is useful to try a few guesses in the changing cells. There are two reasons for doing this. • First, by entering different sets of values in the changing cells we can confirm that the formulas are working correctly. • The second reason for trying a few guesses is to provide a better understanding of the model.
Developing the Model -- continued • For example, it is tempting to guess that the frame types with the highest profit margins should be produced to the greatest extent possible. If we try this out we get solution on the following slide. The profit is $8750. • We now have produced as much as possible of the three frame type with the highest profit margins. • Does this guarantee that this solution is the best possible product mix? Unfortunately, it does not!
Developing the Model -- continued • Using the Solver – To invoke Excel’s Solver, select the Tools/Solver menu item. The dialog box shown here appears. • It has three important sections that you must fill in: the target cell, the changing cell, and the constraints.
Developing the Model -- continued • To enter the information we can type cell references or we can point, click and drag. • Objective. Select the TotProfit cell as the target cell, and click on the maximize button. • Changing cells. Select the Produced range, the numbers of frames to produce, as the changing cells. • Constraints. Click on the Add button to add the following constraints: Used<=Available and Produced<=MaxSales. The first constraint says use no more of each resource than available. The second constraint says to produce no more of each product than can be sold.
Developing the Model -- continued • Nonnegativity. Because negative production quantities would make no sense, we must tell Solver explicitly to make the changing cells nonnegative. There are two ways to do this. • First, we can add another constraint as in the step above Produced>=0. (This was the only way in versions before Excel 97) • Second, we can click the Options button in the Solver dialog box and check the Assume Non-Negative box in the resulting dialog box on the next slide. This automatically ensures that all changing cells are nonnegative.
Developing the Model -- continued • Linear model. There is one last step before clicking on the Solve button. The Solver uses one of several methods to solve various type of models. This model and others in this chapter are all linear models. To instruct Excel to use this method, we also check the Assume Linear Model in the Solver options dialog box.
Developing the Model -- continued • Optimize. Click on the Solver button in the Solver dialog box. • At this point the Solver searches though a number of possible solutions until it finds the optimal one. When it finishes it displays the message shown here. You have the option to return the values to their original or retain the optimal values. Click OK.
Optimal Solution -- continued • The optimal plan is to produce 1,000 type 1 frames, 800 type 2 frames, 400 type 3 frames, and no type 4 frames. • This is close to the production plan devised earlier but it earns $450 more profit and uses all of the available labor and metal but only 8,000 of the 10,000 available ounces of glass. • In terms of maximum sales, the optimal plan could produce more of frame 2, 3, and 4 if more labor and metal were available.
Optimal Solution -- continued • This is typical of an LP solution. Some of the constraints are met exactly – that is as equalities – while others contain a certain amount of “slack”. • The constraints that hold as equalities are called binding constraints, whereas the ones with slack are called nonbinding. • You can think of the binding constraints as “bottlenecks”. They are the constraints that prevent Monet from earning even higher profits.
Experimenting with New Inputs • If we want to experiment with different inputs to this problem – the unit revenues, or resource availabilities, for example – we can simply change the inputs and the rerun the Solver. • The second time we use Solver we do not have to respecify the target and changing cells or the constraints. • As a simple what-if example, consider the modified model on the next slide.
Experimenting with New Inputs -- continued • Here the unit selling price for frame type 4 has increased from $21.50 to $26.50, and all other inputs have remained the same. • By making type 4 frames more profitable we expect them to enter the mix. This is exactly what happens. • There is one technical note we should mention. Because of the way numbers are stored and calculated on a computer, the optimal values in the changing cells and elsewhere can contain small roundoff errors. For example in cell E16 on our PC it was 8.713E-09, a very small number. For all practical purposes this is 0, and we have formatted it as such.