Download
1 / 36
360 likes | 780 Vues
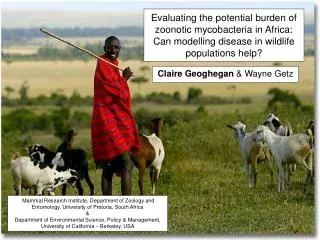
Evaluating the potential burden of zoonotic mycobacteria in Africa: Can modelling disease in wildlife populations help?. Claire Geoghegan & Wayne Getz . Mammal Research Institute, Department of Zoology and Entomology, University of Pretoria, South Africa &

E N D
Evaluating the potential burden of zoonotic mycobacteria in Africa: Can modelling disease in wildlife populations help? Claire Geoghegan & Wayne Getz Mammal Research Institute, Department of Zoology and Entomology, University of Pretoria, South Africa & Department of Environmental Science, Policy & Management, University of California – Berkeley, USA
Introduction Introduction • Drivers of disease • Tuberculosis and HIV • The role of Bovine tuberculosis (BTB) in animal health • Research to date • Future work
‘Throughout the region people are walking a thin tightrope between life and death. The combination of widespread hunger, chronic poverty and the HIV/AIDS pandemic is devastating and may soon lead to a catastrophe. Policy failures and mismanagement have only exacerbated an already serious situation.’ James Morris , World Food Programme’s Executive Director, July 2002,
Cunningham et al. Disease in animals and humans – why should we care? Of allhuman pathogens, 62% are zoonotic and attributed to animals Livestock pathogens that can infect wildlife Human pathogens that can infect wildlife 54% 44% If a pathogen can infect wildlife, > 2x likely to cause an emerging human disease
E. J Woolhouse et al, 2005 Number of zoonotic pathogen species associated with different types of nonhuman host Pathogens in species
Important to understand the temporal and spatial dynamics of pathogens in human and animal reservoirs and populations • Emerging infections • novel paths to infect naïve hosts • drastic effect on host health and mortality • infect multiple species, promoting residence of pathogen in the system • affect population levels and fecundity rates • impact on conservation management • economic and social consequences (direct and indirect)
What drives disease? M. E. J Woolhouse et al, 2005 It is imperative to understand the fundamental dynamics of infectious diseases in order to mitigate the impacts on public health, wildlife and livestock economies
75% HIV Global distribution 8 million new cases / year ~3 million deaths / year 1/3 of people are infected and have latent or active tuberculosis Over 90% of people in Africa have been exposed to the TB bacilli 86% HIV and TB 80% of global case load in developing countries TB is an ancient contagious disease, discovered in 5000 B.C L. Blanc et al, 2002
MRC report, 2000 / Hosegood et al The Real World
Reported BTB Disease Status in Africa W. Y Ayele et al, 2004
Bovine TB – a hidden threat Global distribution Listed as a categoryBdisease by the OIE Chronic disease that has an effect on animal populations and productivity Annual worldwide losses ~$3 billion (trade) Wide host range, including; ruminants, predators, scavengers, small mammals Difficult to eradicate due to the large disease reservoir apparent in wildlife F Biet et al, 2005
Clinical Signs and Symptoms Infected cattle may present with progressive emaciation, capricious appetite and a fluctuating fever. However, many infected animals do not show any clinical abnormalities.
Tuberculin Skin Test • Test uses comparative reaction to M.bovis and M. avium • Sensitivity ranges from 68 – 95% • Specificty ranges from 96 – 99% • Results are affected by: • potency and dose of tuberculin • the interval of time post-infection • desensitisation • deliberate interference • post-partum immunosuppression • observer variation • exposure to M. avium, M. paratuberculosis and environmental mycobacteria and by skin tuberculosis
Routes of Transmission 1 Oral; 2 Aerosol; 3 Passive; 4 Derivative Product; 5 Vertical; 6 Horizontal; 7 Predation
Why is zoonotic TB so serious? • Causes extra-pulmonary manifestations (9.4% of global TB) • Slow to develop and infects many organs, which makes treatment difficult • Multi Drug Resistant to the top 10frontline drugs. This increases the duration and cost ( x 10) of treatment Why should we be concerned? • In Africa, 80% of the population is rural and depend solely on livestock for food and wealth (AU 2002) • 85% cattle, 82% people live where BTB is only partially controlled • 90% of the total milk produced in Africa is consumed raworsoured Thoen and Steele (1995)
The Great Limpopo Transfrontier Park Links South Africa, Mozambique and Zimbabwe
TSETSE FLIES FMD STRAINS TB BRUCELLOSIS FMD RABIES TSETSE FLY TB BRUCELLOSIS FMD STRAINS CANINE DIST. Health challenges in the park MAJOR LOCAL COMMUNITIES WITH DOMESTIC ANIMALS IN AND AROUND PARK
2020 2006
Bovine tuberculosis is an exotic disease introduced from Europe No co-evolution of host and pathogen BTB was first noted in the 1990’sbut probably entered the park in the South East in the1960’s Incorrect temporal scale used for prediction Thought to only infect buffalo Found in lions, kudu, warthog, baboons, small antelope Not the top priority Anthrax, rabies and FMD more threatening! Why was the prediction so wrong?
Collared 100+ buffalo in Kruger National Park Followed herds to get visual data on individuals Branded ~500 buffalo (roughly 2% of population) Mass captures to test for BTB Marked additional buffalo with ID collars Removed infected buffalo for pathology analysis Study design How the network of connections between individuals and the interactions of group size, movement and recovery affect the probability of BTB infection in structured populations.
Traditional animal disease models assume random mixing of individuals, not the individual connections Spatial disease models assume limited dispersal between fixed groups Why was this approach unique? BUT: individuals risk of infection depends on the global state of the population • Network perspective: individual risk of infection depends on the number and frequency of connections with infected individuals • Population structure • Landscape topology • Total number of infected individuals • Speed of the disease spread Important in determining the probability of disease infection and invasion
Monthly radio-tracking data used to create social networks Balls represent individual buffalo and lines show all non-zero association values. Individuals are distributed vertically according to herd membership These were used to simulate disease dynamics along with other factors including scale and behaviour (females move!) Cluster analysis indicated that buffalo were less tightly clustered in 2003 compared to 2002 Thus, increased host mixing during this time (dry year) would help facilitate disease invasion spread Climate may play a role in herd movements and in BTB spread Cross et al. 2004
Five critical issues: 1. What defines a contact for airborne diseases? 2. What are the appropriate time and spatial scales to sample an animal network? 3. How do you confidently scale up a sample to represent an entire population? 4. How to allow for birth and deaths and changes of association patterns while maintaining the overall properties of the network? 5. Is there a difference in behaviour between susceptible and infected individuals?
Is variance in connection strengths and frequency of contact in individuals important? How does the duration of infectiousness affect the degree of disease experienced by the population structure? Why are some hosts affected more than others? How does incorporation of non-random association data affect predictions about the speed and intensity of a disease outbreak? How do we get more empirical data and projects to run that require that data?
Models are constructions of knowledge and caricatures of reality Beissinger and Westphal,1998
Complex web of socio-economic factors pertinent to controlling disease for feasible, affordable and effective public health policies to be devised and implemented Host-pathogen interactions in ecological and socio-economic settings are complex, non-linear systems which required detailed maths and statistical analysis Need experience of biological systems and technical knowledge Need improved health care systems and information systems about health in order to generate reliable statistics that can be used to monitor progress
Locate and Quantify Infection Practical Risk Factors Social, Cultural, Economic Factors of Disease Dynamics Model and Map for Predictions
The Way Forward….. Policy Integrated Science ‘One Medicine’ Stakeholder Involvement Capacity Building / Retention of Ideas
“Knowing is not enough, we must apply. Willing is not enough, we must do." Goethe
Acknowledgements The project is thankful for the support of the DIMACS / SACEMA and AIMS Mammal Research Institute, and the Department of Zoology and Entomology at the University of Pretoria, South Africa Division of Ecosystem Sciences, Department of Environmental Science, Policy and Management at the University of California – Berkeley, USA.