Deglaciation
Deglaciation. LGM climate controlled by Ice sheets and atmospheric CO 2 Deglacial world shift Higher insolation and CO 2 Smaller ice sheets As insolation increased Ice sheets melted Influenced climate much less CO 2 had a largely secondary role in climate. Timing of Ice Sheet Melting.

Deglaciation
E N D
Presentation Transcript
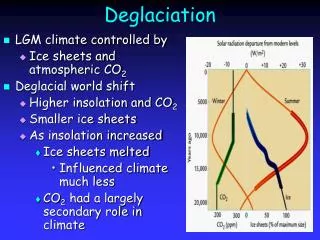
Deglaciation • LGM climate controlled by • Ice sheets and atmospheric CO2 • Deglacial world shift • Higher insolation and CO2 • Smaller ice sheets • As insolation increased • Ice sheets melted • Influenced climate much less • CO2 had a largely secondary role in climate
Timing of Ice Sheet Melting • Determined by dating organic remains formed during ice sheet retreat • Although scarce, suitable samples exist • N. American ice sheets began retreating 14,000 14C years ago • Gone by 6,000 14C years ago • Area does not yield ice volume • Thickness of ice debatable
Sea Level from Coral Reefs • One meter of sea level rise = 0.4 million km3 of ice • Total global ice volume can be compared with insolation record • Coral reefs on Barbados gave sea level history • Know Barbados had minor subsidence • 14C dated sea level curve supports expectations • Rate of sea level rise maximized during maximum summer insolation • Insolation record well known • Summer insolation maximum 10,000 years ago • Barbados corals gave a 14C dated record of sea level rise
14C Age Not True Age • When 14C dated corals dated by Th/U • 14C ages were too young • Implication was that rate of 14C production from 14N • Greater during LGM • More 14C present in sample • Gives an age that is too young • Young age confirmed by tree ring studies
Implications for Ice Volume • The Th/U chronology more accurate • Highest rates of sea level rise • Before maximum summer insolation • The bigger they are, the quicker they melt • Generally consistent with Milankovitch theory • Response time curve predict lag • Must be other feedbacks at work
Rise in Sea Level Not Smooth • Record of sea level rise is not smooth • Rapid rise from 20K to 14K years ago • Slow from 14-12K years • More rapid rise after 12K years • Rates of sea level rise changed dramatically
Rate of Sea Level Rise • Rate of sea level rise slowed significantly between 14K and 12K years ago • Two major pulses of freshwater influx to oceans • Melting glaciers • Glacier melting episodic • Flow of meltwater to oceans episodic
Meltwater Pulses • Oxygen isotopic composition of planktic foraminifera • Monitor freshwater influx to ocean • Anomalously low d18O measured in foraminifera • Norwegian Sea • Barents Sea ice sheet • Gulf of Mexico • Laurentide ice sheet via the Mississippi River
Meltwater Pulses – Additional Evidence • Ice-rafted debris in non-fossiliferous sediments west of Ireland • Suggest large influx of fresh water into North Sea • Sourced by massive release of ice bergs • Sediments deposited between 17K and 14.5K years ago • Coincide with first major meltwater pulse • Calving ice bergs would accelerate ice sheet melting
Younger Dryas • Mid-deglacial pause in ice melting • Accompanied by brief climate cooling • Particularly in subpolar N. Atlantic Ocean • Pollen records in Europe and Scotland indicate • Cold-tolerant tundra (including the Arctic plant Dryas) • Displaced early growth of forests • Evidence of Younger Dryas also found in N. Atlantic sediments
Younger Dryas • Southward re-advance of polar water in the N. Atlantic evident in faunal assemblages • Reversal towards Artic vegetation in Europe • Cold-tolerant insects in England (~7°C)
Younger Dryas • Recorded in Greenland ice core • Ice sheet accumulation rates changed abruptly • Ice accumulation slow during LGM and Younger Dryas • Large changes in windblown dust • As indicated by Ca content in cores • Younger Dryas was cold, dry and windy climate
Causes of Younger Dryas • Broecker called upon change in NADW formation • Meltwater diverted from Gulf of Mexico to N. Atlantic • Pulse of low-salinity meltwater cut off NADW formation • Cut off heat transfer to subpolar Atlantic from tropics
Critics of Broecker • Meltwater pulses to N. Atlantic • Occurred when global rates of ice melting were a factor of 5 lower • With such low rates of meltwater influx • How could such a small diversion cause such a big change in climate? • Mechanisms causing cooling hotly debated • Cooling appears global (e.g., greenhouse gases) • Signal could be transferred quickly from N. hemisphere ice sheets
Testing Broecker’s Model • If thermohaline overturn in N. Atlantic slowed • Decrease northward heat transport • Warm tropical Atlantic • If greenhouse gas reduction • Produced Younger Dryas cooling • Expect synchronous global cooling • SST measurements in tropical Atlantic • Help sort out mechanism • Greenland ice core records clearly document N. hemisphere, high latitude cooling • Due to heat released from N. Atlantic • N. Atlantic cooled
Synchronous or Asynchronous Cooling? • Oxygen isotope records from GRIP and Byrd ice cores • Temperature differences between N. and S. hemispheres • Suggest asynchronous cooling • Changes in rates of NADW formation • Yet terrestrial climate records suggest synchronous cooling • Changes in greenhouse gas concentrations • Oceanic or atmospheric control
Temperature Records • SST based on alkenone unsaturation in core taken near Grenada • Tropical western N. Atlantic (12°N) • d18O from coexisting planktic foraminifer • During Younger Dryas • Alkenone SST increase • GRIP temperature decreases • Asynchronous cooling
Mechanisms of Change • Compare SST with benthic Cd/Ca • Cd/Ca record from Bermuda Rise • Cd indicator of phosphate • Barometer of changes in the source of deep water • Low nutrient N. Atlantic deep water • High nutrient Antarctic sources • Cd/Ca maximum in younger Dryas indicates less NADW • Slowdown in NADW formation from injection of freshwater • Cooled N. Atlantic and Greenland • Less heat transferred N. from tropics so tropics warmed
Support from 10Be • Variations in production rates of atmospheric 10Be and 14C • Linked to solar activity and Earth’s magnetic field • Concentration of atmospheric 14C also affected by removal of radiocarbon • Changes in global carbon cycle • Muscheler et al. (2000 Nature, 408:567-570) used 1OBe to constrain production rates of 14C during Younger Dryas • Residual variation due to carbon cycle • Consistent with lower ventilation rates • Therefore a reduction in deep water formation during Younger Dryas
Warm Eastern & Cold Western Atlantic • SST records off northwest Africa show cooling during younger Dryas • Implies southward advection of cold water • Along Canary Current • Meltwater shut down NADW formation • Reduced NADW formation caused • Tropical western and southern Atlantic warmed • Eastern and northern Atlantic cooled • Results predict asynchronous N. and S. hemisphere temperatures in ice cores • On short times scales • Consistent with Cuffy and Vineux (2001)
Paradox: Freshwater Influx? • If rate of NADW formation is reduced by meltwater pulse during Younger Dryas • Why was the pre-Younger Dryas climate and presumably NADW formation seemingly unaffected • Large documented meltwater pulses? • Paradox seemingly resolved if large pulses originated from Antarctic ice sheet • Recent modeling (Clark et al. 2002 Nature, 415:863-869) • Thermohaline circulation sensitive to small changes in hydrologic cycle (~0.1 Sv) • Why no thermohaline circulation in Pacific? • Surface waters are too fresh to sink
Huh? Antarctic Ice Sheet Melting • Large ice sheets melted early and melted fast • d18O data from Norwegian sea imply early melting of Barents ice sheet • Sediments in N. Sea and d18O data in Gulf of Mexico imply melting of Laurentide ice sheet • Indicate N. hemisphere ice sheet melting • Some evidence exists for early deglacial warming in Antarctica • Suggest that this acted as a trigger for melting ice sheets in north polar regions
Abrupt Melting Events • Suggest feed backs in climate system accelerated ice sheet melting • Iceberg calving would increase rate of melting • Moves ice quickly into relatively warm waters • Ice sheets in marginal marine environments • Susceptible to rapid melting • Internal flow of ice sheets increased • Ice fluxed to margins along ice streams • Effectively thinning the ice sheet • Lowering volume but not aerial extent of ice
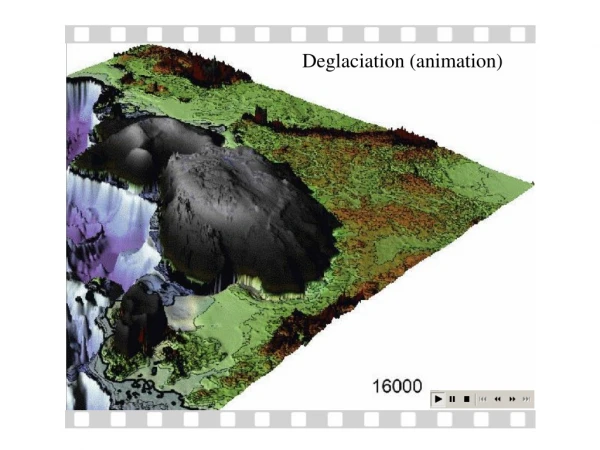
Changes in Landscapes • Morphological changes accompanied deglaciations • Proglacial lakes • Flooding • When impounded water in proglacial lakes was suddenly released • Rise in sea level • Inundation of coastal regions • Submerged land connections between continents exposed during LGM
Proglacial Lakes • Proglacial lakes develop in bedrock depressions left by melting ice sheets • Lake Agassiz, largest proglacial lake N. America • 200,000 km2, 100 m deep (20,000 km3) • Sudden release of large proglacial lakes caused massive floods
Increased Insolation Produced Monsoons • Earth’s orbital configuration 10K years ago • Summer insolation 8% higher than today • Conducive to summer monsoon development • Model simulations supported by geologic observations • Lake levels higher in • Arabia • North Africa • Southeastern Asia
Enhanced Upwelling in Arabian Sea • Strong monsoon winds blowing across Somalia and eastern Arabia • Enhanced coastal upwelling • Altering the planktic foraminifera species
Climate Evidence • Evidence for wet climate range from • Large dry river valleys in deserts • Fossil evidence includes • Grass pollen in lake deposits • Variety of water-loving animals (hippopotamuses, crocodiles, turtles, rhinoceroses, etc)
Timing • 14C dates for lake deposits in N. Africa • Match the 10K insolation maximum • When corrected for greater 14C production
Intensity • Summer insolation 8% higher but lakes 24% larger in volume • Relationship not necessarily linear • Mismatch between models and observations • Required addition of vegetation-moisture feedback
Insolation Reduced Monsoons • Decreased summer insolation expected to weakened summer monsoons • Lake levels in N. Africa match well expected patterns • Most lakes today much lower or dried out
Climate Change Over Last 10K Years • Ice sheets melting (reduced influence) • Atmospheric CO2 levels stable and high • Summer insolation gradually decreasing • Expect warmer and then cooler climate
Vegetation • General gradual movement of warm-adapted biomes north • Pollen records indicate spruce and oak moved north • Mid-glacial produced no-analog vegetation • Mixtures that do not exist today • Different response of a particular type of plant to changing climate
Peak Deglacial Warmth • With atmospheric CO2 levels steady and high • Glacial ice largely melted • Summer insolation and vegetation changes affected temperatures • Insolation 5% higher warmed high latitudes • Displacement of high-albedo tundra by low-albedo spruce caused positive feedback • Greater warming
Cooling Followed Deglacial Warming • Ample evidence for gradual cooling • Summer insolation dropped over last 10K years • Less frequent melting of ice caps • More frequent sea ice off Greenland indicated by drop in diatoms • Advances in ice caps on Arctic islands • Lower Atlantic SST • Southward shift in the boundary between spruce and tundra
Future Climate • Over the next 10K years precession maximize at low latitude • Intensify summer monsoons • Tilt should minimize at high N. latitudes • Help promote further glaciations • Pattern consistent with glaciations in next few thousand years • Predictions complicated by millennial-scale oscillations and anthropogenic greenhouse gases