Download
1 / 17
170 likes | 648 Vues
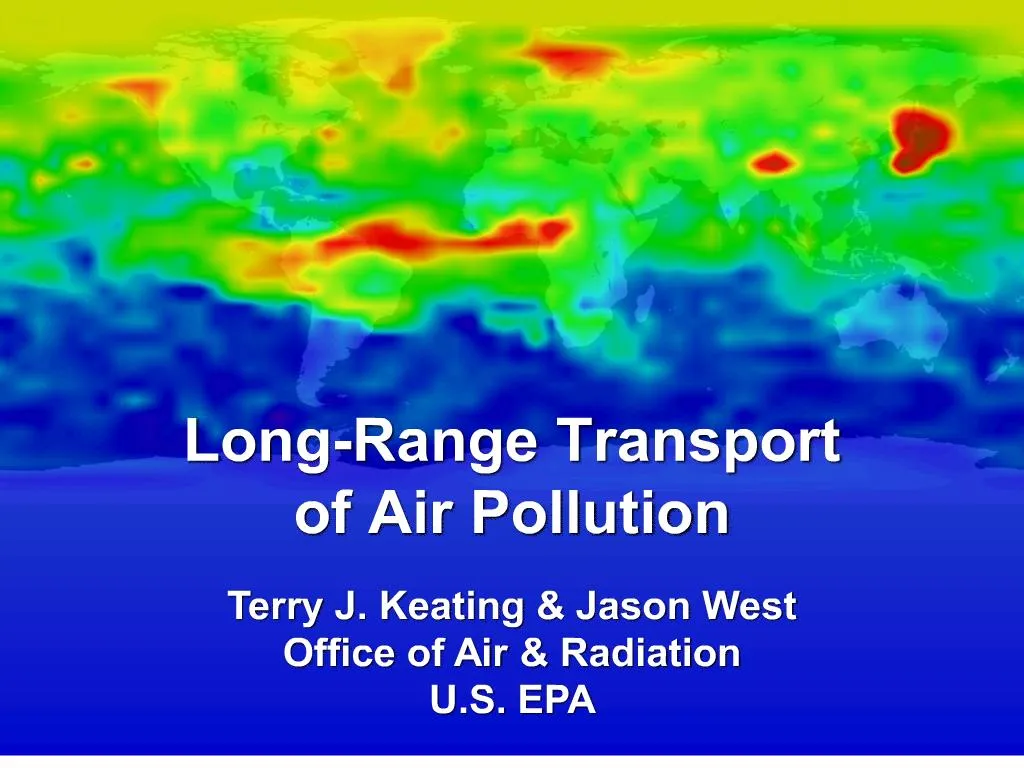
Overview. What do we know about atmospheric transport of air pollution across nations and continents and seas?What are the implications of this long range air transport for U.S. and global environmental quality?What are the implications for global energy systems development and for the role of renewables in future global energy economies?How well are these issues understood, and what additional information or analyses are needed?.

E N D
1. Long-Range Transport of Air Pollution John Beale:
We�re here to talk about the International Transport of Air Pollutants or ITAP.
We believe that this is a very important issue that is looming on the horizon and will continue to grow in importance. We believe that we need to begin taking a hard look at how we, as an Agency, are going to respond to this issue.
Two years ago, (in May 2000), OAR and OIA invited all the other offices in the Agency to participate in an ITAP Working Group, to explore
what we know about international transport
what we are doing about it currently
what we need to do about it in the future.
The group has participants from almost all Offices and many Regions.John Beale:
We�re here to talk about the International Transport of Air Pollutants or ITAP.
We believe that this is a very important issue that is looming on the horizon and will continue to grow in importance. We believe that we need to begin taking a hard look at how we, as an Agency, are going to respond to this issue.
Two years ago, (in May 2000), OAR and OIA invited all the other offices in the Agency to participate in an ITAP Working Group, to explore
what we know about international transport
what we are doing about it currently
what we need to do about it in the future.
The group has participants from almost all Offices and many Regions.
2. Overview What do we know about atmospheric transport of air pollution across nations and continents and seas?
What are the implications of this long range air transport for U.S. and global environmental quality?
What are the implications for global energy systems development and for the role of renewables in future global energy economies?
How well are these issues understood, and what additional information or analyses are needed? John Beale:
The purpose of today�s meeting is to:
Provide you with a brief overview of what we know about this phenomenon.
Present the conclusions that this group has come to about what this might mean for the Agency.
Get your views on how you think we should proceed to address this issue, as an Agency.
For the first part of the presentation, I�m going to turn the floor over to Terry Keating, who is one of the co-chairs of the ITAP Working Group.
After we run through the presentation, OIA and ORD (and any other offices represented) will provide additional comments.
John Beale:
The purpose of today�s meeting is to:
Provide you with a brief overview of what we know about this phenomenon.
Present the conclusions that this group has come to about what this might mean for the Agency.
Get your views on how you think we should proceed to address this issue, as an Agency.
For the first part of the presentation, I�m going to turn the floor over to Terry Keating, who is one of the co-chairs of the ITAP Working Group.
After we run through the presentation, OIA and ORD (and any other offices represented) will provide additional comments.
3. This animation shows data from the first global measurements of CO. The data was gathered by MOPITT, a Canadian instrument, flying on NASA�s Terra satellite.
In the Spring, you can see large plumes of CO leaving Asia and impacting the US, as well as plumes coming off the coast of Africa.
In Summer, you can see a large plume of CO from India and SE Asia, pollution events in Mexico City and the Northeast US, and forest fires in Canada and Russia.
In the Fall, you can see the impact of biomass burning in equatorial South America and Africa.This animation shows data from the first global measurements of CO. The data was gathered by MOPITT, a Canadian instrument, flying on NASA�s Terra satellite.
In the Spring, you can see large plumes of CO leaving Asia and impacting the US, as well as plumes coming off the coast of Africa.
In Summer, you can see a large plume of CO from India and SE Asia, pollution events in Mexico City and the Northeast US, and forest fires in Canada and Russia.
In the Fall, you can see the impact of biomass burning in equatorial South America and Africa.
4. Daniel JacobDaniel Jacob
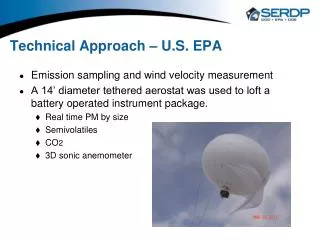
5. Dust storms and fires provide examples of discrete transport events.
6. GOES Satellite Image
7. Historical records suggest a large increase in �background� O3 due to anthropogenic activity. Recent observations confirm an increasing trend.
8. Surface O3 Enhancement from Asian Emissions During TRACE-P Predicted by GEOS-CHEM Daniel JacobDaniel Jacob
9. While most air quality problems are due to local or regional sources, the U.S. is both an importer and exporter of air pollutants. Notes for Terry Keating:
First of all, I�d like to point out that we�re joined on the phone by my co-chair from OIA, Marilyn Engle, who couldn�t be here today.
The arrows on this map depict some of the major flows of air pollutants into and out of the United States.
I�m going to quickly describe each of these flows, starting with flows within North America and then working my way around the map counterclockwise.Notes for Terry Keating:
First of all, I�d like to point out that we�re joined on the phone by my co-chair from OIA, Marilyn Engle, who couldn�t be here today.
The arrows on this map depict some of the major flows of air pollutants into and out of the United States.
I�m going to quickly describe each of these flows, starting with flows within North America and then working my way around the map counterclockwise.
10. Transboundary Flows with Canada & Mexico Pollution flows both ways across our northern and southern borders.
These flows contribute to exceedances of our ambient air quality standards as well as exceedances of standards in Canada and Mexico.
The figure on the left shows the average wind pattern on summer days with the highest ozone levels. You can see significant winds that carry pollutants in Southern Texas and across Southeastern Canada.
(The yellow areas are are the source regions that account for most of the pollutants in several key cities: Houston, Atlanta, Chicago, Columbus, and New York.)
The flows, however, don�t always go north. You may remember last July�s forest fires in Quebec that literally darkened the sky from New England to DC.
As the three national economies and energy systems become further integrated, continued development along both borders is an increasingly important source of emissions.
The figure on the right shows an annual emissions inventory for SO2 developed as part of the BRAVO study, looking at visibility in Big Bend National Park. Ignoring the tall spike south of Mexico City, which is a volcano, you can see the emissions spike caused by the Mexican power plants, Carbon 1 and 2.
Pollution flows both ways across our northern and southern borders.
These flows contribute to exceedances of our ambient air quality standards as well as exceedances of standards in Canada and Mexico.
The figure on the left shows the average wind pattern on summer days with the highest ozone levels. You can see significant winds that carry pollutants in Southern Texas and across Southeastern Canada.
(The yellow areas are are the source regions that account for most of the pollutants in several key cities: Houston, Atlanta, Chicago, Columbus, and New York.)
The flows, however, don�t always go north. You may remember last July�s forest fires in Quebec that literally darkened the sky from New England to DC.
As the three national economies and energy systems become further integrated, continued development along both borders is an increasingly important source of emissions.
The figure on the right shows an annual emissions inventory for SO2 developed as part of the BRAVO study, looking at visibility in Big Bend National Park. Ignoring the tall spike south of Mexico City, which is a volcano, you can see the emissions spike caused by the Mexican power plants, Carbon 1 and 2.
11. Mercury Deposition ~40% of all Hg deposition to the lower 48 states comes from emission sources outside the U.S. or from U.S. emissions that have been transported across international boundaries
12. Imports to Alaska & Arctic Europe and Asia both contribute to pollution in the Arctic, where mercury and POPs tend to accumulate and pose a health threat to indigenous people and ecosystems.
Transport into the Arctic is driven by the expansion and contraction of the Arctic Air Mass, which in winter extends down over many parts of industrialized Europe and Asia. Europe and Asia both contribute to pollution in the Arctic, where mercury and POPs tend to accumulate and pose a health threat to indigenous people and ecosystems.
Transport into the Arctic is driven by the expansion and contraction of the Arctic Air Mass, which in winter extends down over many parts of industrialized Europe and Asia.
13. The Developing World
14. Simulated increase in mean U.S. surface ozone (ppbv) from tripling of Asian emissions (1985 to 2015).
15. IPCC-SRES global emission trends vs. national medium-term projections
16. International Development and Use of Renewable Energy Sources Will � Change the magnitude, distribution, and characteristics of emissions.
What emissions will result from the renewable energy sources and what emissions will these sources displace?
What will be the change in chemical composition of emissions?
e.g., sulphate v. black carbon
What will be the change in the release characteristics of emissions?
e.g., tall stacks v. distributed stove pipes After looking at this evidence and doing a survey of activities and interests around the Agency, we�ve come to the following five conclusions:
The U.S. is both an importer and exporter of air pollutants.
After looking at this evidence and doing a survey of activities and interests around the Agency, we�ve come to the following five conclusions:
The U.S. is both an importer and exporter of air pollutants.
17. International Development and Use of Renewable Energy Sources Will � Change the magnitude, distribution, and characteristics of emissions.
Provide opportunities to decrease multiple pollutants and achieve multiple policy objectives simultaneously.
What are the full, life-cycle environmental impacts?
Criteria Pollutants, Toxic Pollutants, Greenhouse Gases and Aerosols, Nutrient and Acidifying Deposition
What are the impacts on other policy objectives?
Local Health Impacts, Long Range Transport Impacts, Climate Change, Energy Security After looking at this evidence and doing a survey of activities and interests around the Agency, we�ve come to the following five conclusions:
The U.S. is both an importer and exporter of air pollutants.
After looking at this evidence and doing a survey of activities and interests around the Agency, we�ve come to the following five conclusions:
The U.S. is both an importer and exporter of air pollutants.
18. International Development and Use of Renewable Energy Sources Will � Change the magnitude, distribution, and characteristics of emissions.
Provide opportunities to decrease multiple pollutants and achieve multiple policy objectives simultaneously.
Provide potential cost-effective means of achieving domestic goals.
What are the relative costs and benefits of investment in the international development of renewable energy sources versus investment in domestic pollution control?
What would be the impact of pursuing pollution control internationally on domestic development of renewable energy sources? After looking at this evidence and doing a survey of activities and interests around the Agency, we�ve come to the following five conclusions:
The U.S. is both an importer and exporter of air pollutants.
After looking at this evidence and doing a survey of activities and interests around the Agency, we�ve come to the following five conclusions:
The U.S. is both an importer and exporter of air pollutants.